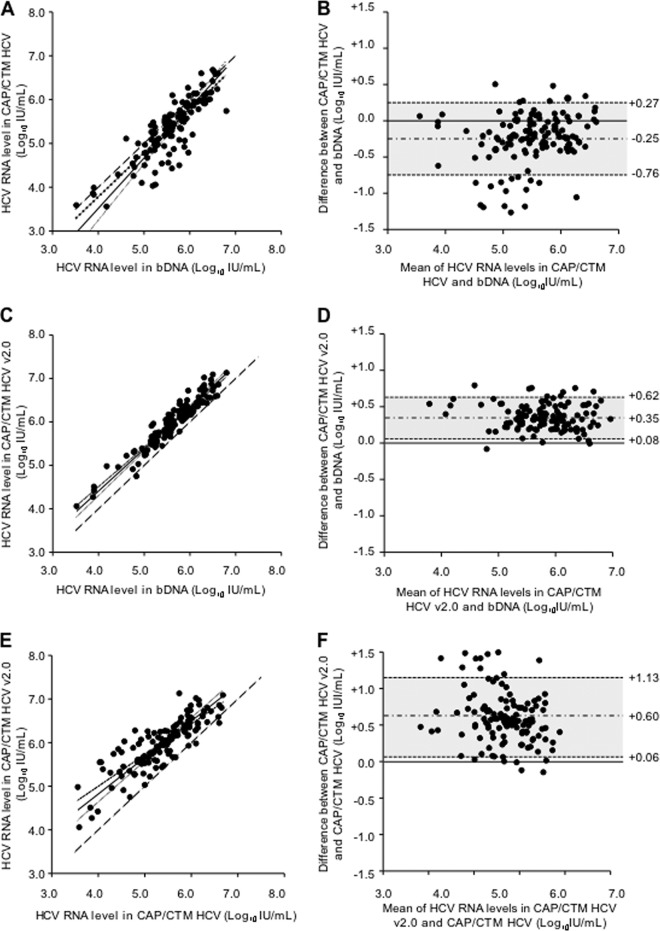
Fig 1.
Deming correlation and Bland-Altman plot analyses of HCV RNA levels determined by bDNA, CAP/CTM HCV, and CAP/CTM HCV v2.0 in 122 clinical samples (group A) containing different subtypes of HCV genotype 4. (A) Deming regression of CAP/CTM HCV versus bDNA. (B) Bland-Altman plots of CAP/CTM HCV versus bDNA. (C) Deming regression of CAP/CTM HCV v.2.0 versus bDNA. (D) Bland-Altman plots of CAP/CTM HCV v2.0 versus bDNA. (E) Deming regression of CAP/CTM HCV v2.0 versus CAP/CTM HCV. (F) Bland-Altman plots of CAP/CTM HCV v2.0 versus CAP/CTM HCV. In the Deming regression figures, the dashed line is the identity line; the black line surrounded by two dashed lines shows the Deming fit and 95% confidence interval, respectively. In the Bland-Altman figures, the difference between the HCV RNA levels obtained by the two assays is plotted as a function of the mean of the two values; the gray area and numbers correspond to the mean difference ± 1.96 standard deviation.

