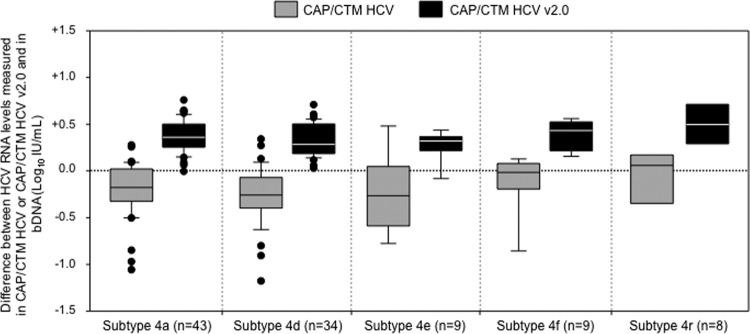
Fig 2.

Box plot representation of the distribution of the differences between the HCV RNA levels obtained by the CAP/CTM HCV v2.0 assay and those obtained by the bDNA assay, according to the HCV genotype 4 subtype. Only subtypes with more than five samples are represented. The midline and lower and upper edges of the boxes represent the median value, 25th percentile, and 75th percentile, respectively. The lower and upper error bars represent the 10th and 90th percentiles, respectively. The dots represent values that are below the 10th percentile or above the 90th percentile.
