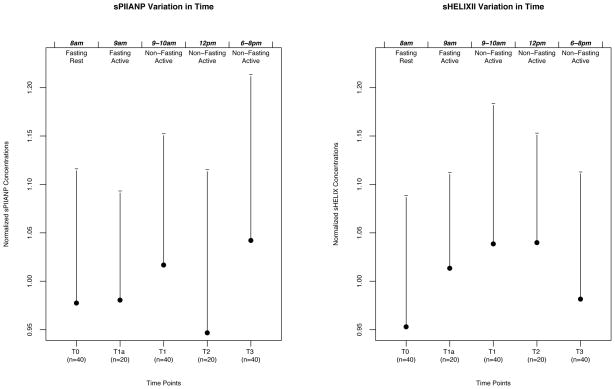
Figure 1.
Normalized Concentrations of sHELIX and sPIIANP vs. Timepoints. The time of collection is indicated at the tip of the figure. The status (fasting vs. non-fasting; at rest vs. active) is indicated at the bottom of the figure for each timepoint. Figure plots represent mean normalized biomarker concentrations ± one standard deviation.

