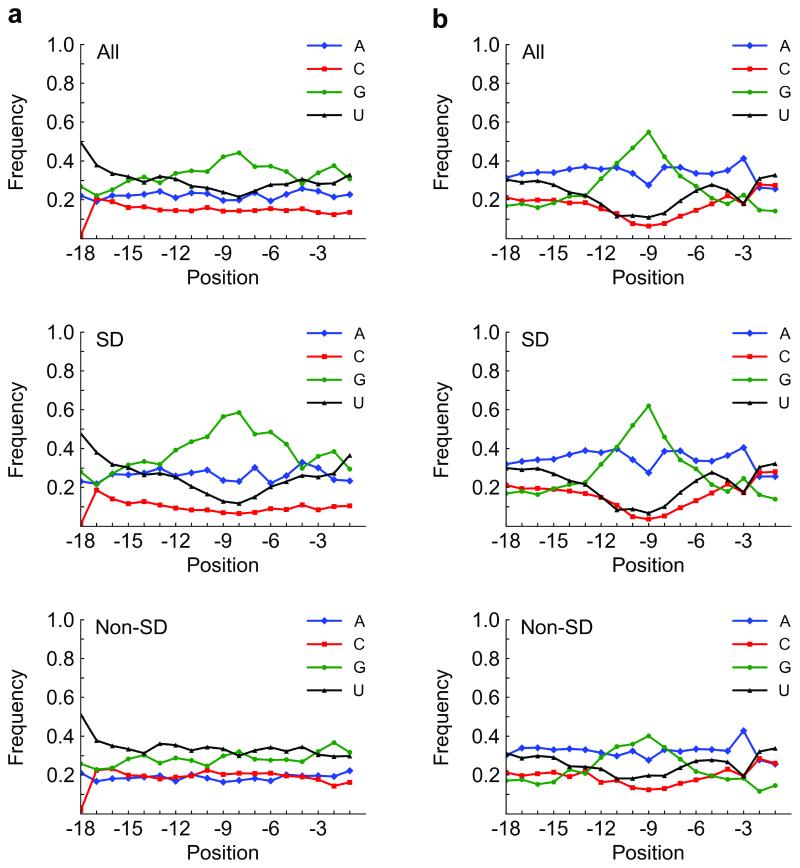
Figure 3.
Base content vs. position in our selection and in E. coli. a) Base content vs. position in all, SD (46%), and non-SD (54%) sequences, respectively, in our selection (after third round). Overall (top panel), the nucleotide G is abundant around position −9 or −8, which reflects SD content (middle panel). Interestingly, the non-SD sequences (bottom panel) are mostly G/U-rich. b) Base content vs. position in all, SD (67%), and non-SD (33%) sequences, respectively, from the 18 bases before the start codon in E. coli K12 W3110 (NCBI TaxID 316407; Transterm database (22)). Generally, the base distribution resulting from our selections mimicked that in E. coli. The G peak that appears in our library appears at approximately the same position in E. coli, primarily from the SD sequence. Position is specified by the first base of the motif relative to the start codon. SD, Shine-Dalgarno.

