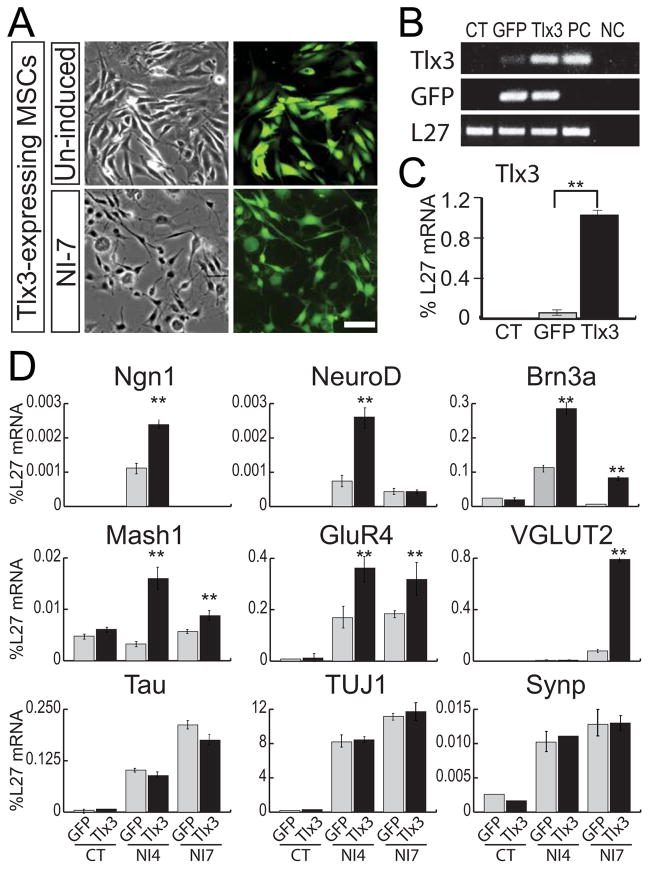
Figure 6. Forced expression of Tlx3 results in up-regulation of sensory and glutamatergic marker genes in neurally-induced MSCs.
(A) Forced expression of Tlx3 in MSCs. Virtually 100% of MSCs expressing pBud-eGFP-cTlx3 in the figure are GFP-positive and remain stably exhibiting GFP expression after neural induction. Scale bar: 100 μm. (B and C) RT-PCR analysis for GFP and Tlx3 in neurally-induced MSCs expressing pBud-eGFP (GFP) or pBud-eGFP-cTlx3 (Tlx3). PC; E10 otocyst, NC; no cDNA. (D) qRT-PCR analysis for Ngn1, NeuroD, Brn3a, Mash1, GluR4, VGLUT2, Tau, TUJ1 and Synp in MSCs expressing the Tlx3 expression vector (Tlx3) in comparison with those expressing the control vector (GFP). Undifferentiated MSCs (CT) or MSCs grown in neural induction medium for 4 days (NI4) or 7 days (NI7). **P<0.001

