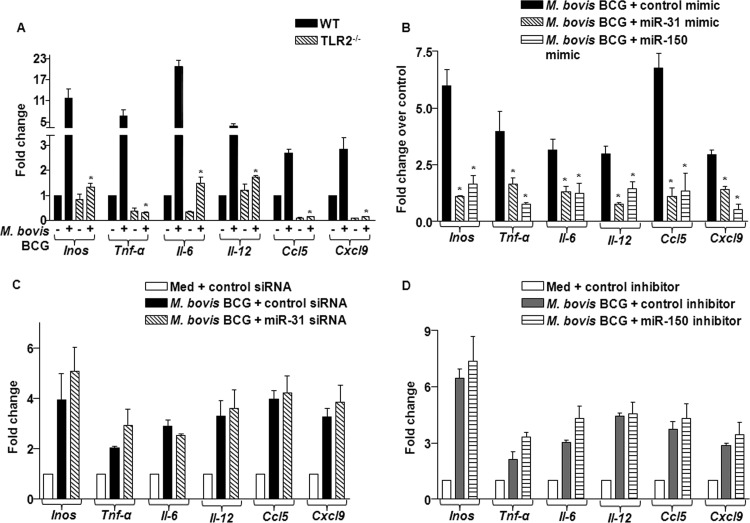
Fig 10.
miR-31 and miR-150 control TLR2-responsive inflammatory gene expression. (A) WT and TLR2-null macrophages were infected with M. bovis BCG for 12 h. Total RNA was isolated, and the levels of Inos, Tnf-α, Il-6, Il-12, Ccl5, and Cxcl9 transcript expression were analyzed using quantitative real-time RT-PCR. Data represent means ± SEs (n = 3). *, P < 0.05 versus WT M. bovis BCG-infected cells. (B) Macrophages were transfected with the control mimic, miR-31 mimic, or miR-150 mimic for 72 h. After M. bovis BCG infection for 24 h, expression of Inos, Tnf-α, Il-6, Il-12, Ccl5, and Cxcl9 was analyzed using quantitative real-time RT-PCR (mean ± SE, n = 3). *, P < 0.05 versus M. bovis BCG-infected cells. (C and D) Macrophages were transfected with control siRNA or miR-31 siRNA (C) or with control inhibitor or miR-150 inhibitor (D). After 72 h of transfection, cells were infected with M. bovis BCG for 24 h, and expression of the indicated genes was analyzed using quantitative real-time RT-PCR. Data represent means ± SEs (n = 3).

