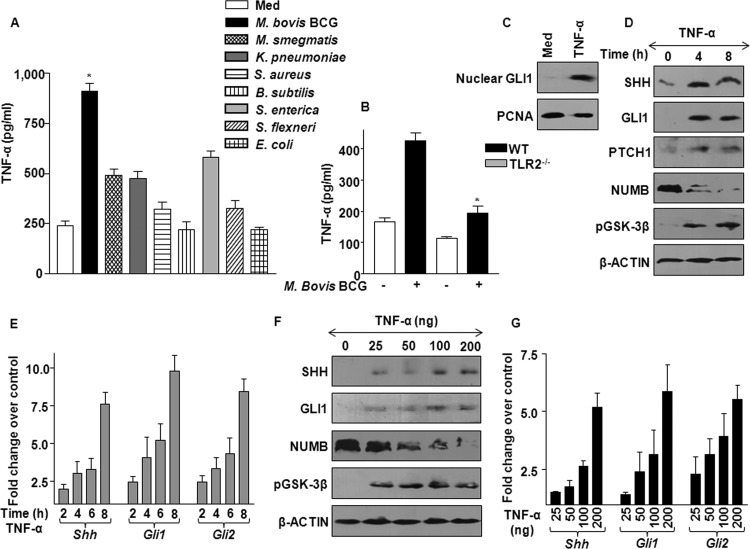
Fig 3.
M. bovis BCG infection-induced TNF-α activates SHH signaling. (A) TNF-α protein levels were measured using ELISA. Macrophages were infected with various pathogens and nonpathogens, as shown, for 12 h, and total secreted TNF-α protein levels were measured in cell-free supernatants. The data represented were obtained from 3 separate experiments. *, P < 0.05 versus uninfected macrophages. (B) ELISA was performed to access secreted TNF-α from M. bovis BCG-infected WT and TLR2-null macrophages (mean ± SE, n = 3). *, P < 0.05 versus WT-infected macrophages. (C) The nuclear fraction from TNF-α-treated macrophages was evaluated for GLI1 nuclear translocation compared to that in untreated macrophages. Blots are representative of 3 independent experiments. (D) Macrophages were treated with TNF-α at the indicated time points, and immunoblotting was performed on total cell lysate with antibodies against SHH, GLI1, PTCH1, NUMB, and pGSK-3β. Data are for 3 independent experiments. (E) Macrophages were treated as described for panel D, and induced expression of Shh, Gli1, and Gli2 transcripts was assayed by quantitative real-time RT-PCR analysis. These results are representative of 3 separate experiments. (F) Activation of SHH signaling with increasing doses of TNF-α treatment was assayed by immunoblotting. Equal loading of proteins was ensured by probing blots with anti-β-actin antibody. (G) Macrophages were treated as described for panel F, and Shh, Gli1, and Gli2 transcript levels were determined using quantitative real-time RT-PCR (mean ± SE, n = 3).

