Fig 6.
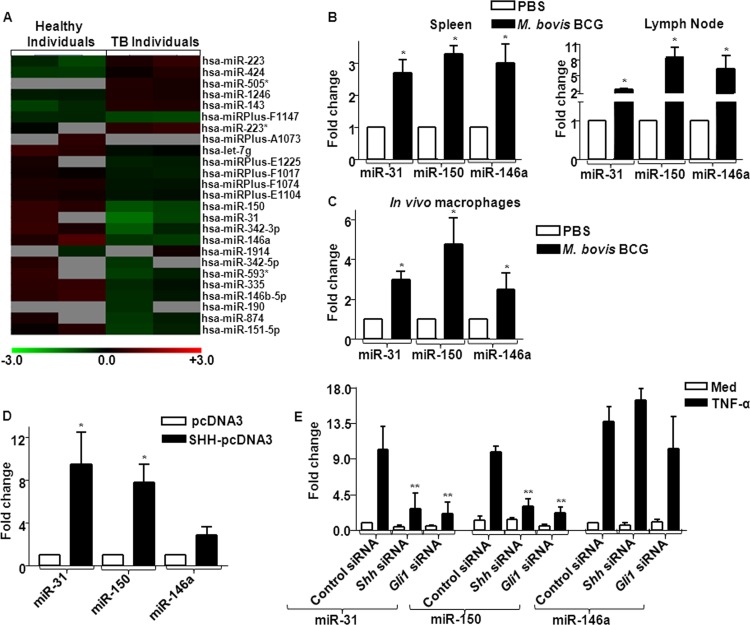
Modulation of miR-31, miR-150, and miR-146a during mycobacterial infection. (A) Genome-wide miRNA microarray profiling was done in PBMCs from TB patients or healthy individuals. A heat map of the profile in TB patients (n = 4) compared with that in healthy individuals (n = 4) is shown. (B) Mice were intravenously challenged with M. bovis BCG for 5 days, and levels of miR-31, miR-150, and miR-146a expression in spleen and lymph nodes were analyzed by quantitative real-time RT-PCR. *, P < 0.05 compared to PBS-injected or uninfected mice. (C) Mice were i.p. infected with M. bovis BCG in vivo, and total levels of miR-31, miR-150, and miR-146a expression were assayed as described for panel B. *, P < 0.05 versus PBS-injected or uninfected mice. (D) SHH was overexpressed in macrophages, and levels of miR-31, miR-150, and miR-146a expression were assayed using quantitative real-time RT-PCR. *, P < 0.05 versus pcDNA3-transfected macrophages. (E) Knockdown of SHH and GLI1 was achieved by transfecting specific siRNAs in macrophages, while the mock-treated set received nontargeted control siRNAs. Quantitative real-time RT-PCR analysis was performed on total RNA isolated from either TNF-α-treated or untreated cells using miR-31-, miR-150-, and miR-146a-specific primers. Results of a representative panel of 3 independent experiments are shown. *, P < 0.05 compared to TNF-α-treated cells with control siRNA.

