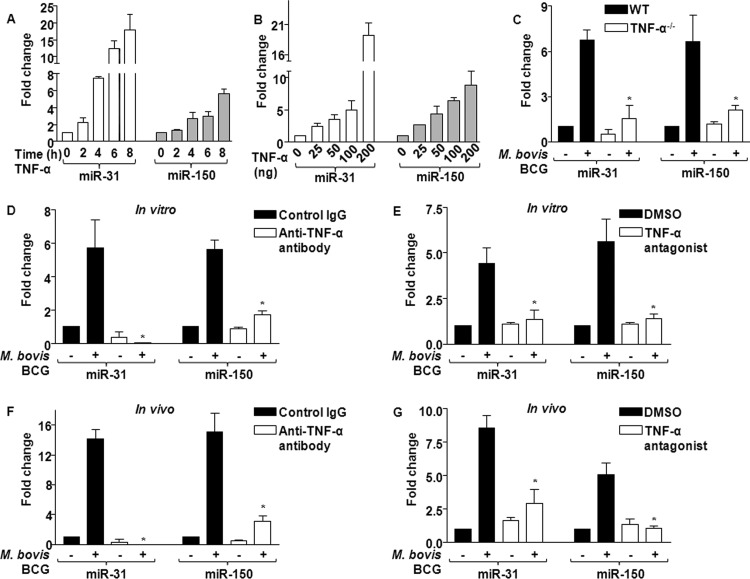
Fig 7.
TNF-α regulates miR-31 and miR-150 expression during mycobacterial infection. (A and B) In vitro kinetics of miR-31 and miR-150 expression in macrophages treated with TNF-α at the indicated time points (A) and different concentrations (B) are shown (mean ± SE, n = 3). (C) TNF-α-null and WT bone marrow-derived macrophages were infected with a 1:10 MOI of M. bovis BCG to analyze the expression of miR-31 and miR-150. Data represent means ± SEs (n = 4). *, P < 0.05 versus M. bovis BCG-infected WT bone marrow-derived macrophages. (D and E) Macrophages were treated in vitro with either anti-TNF-α antibody (10 μg) (D) or TNF-α antagonist (5 μg) (E), and the levels of M. bovis BCG-induced miR-31 and miR-150 expression were assayed by quantitative real-time RT-PCR (mean ± SE, n = 4). *, P < 0.05 compared to M. bovis BCG-infected control IgG-treated/DMSO-treated cells. (F and G) Mice were i.p. injected with either anti-TNF-α antibody (0.1 mg) or TNF-α antagonist (0.5 mg) 6 h prior to M. bovis BCG i.p. infection. The levels of miR-31 and miR-150 expression analyzed were similar to those shown in panels D and E (mean ± SE, n = 4). *, P < 0.05 compared to M. bovis BCG-infected control IgG/DMSO-treated mice.

