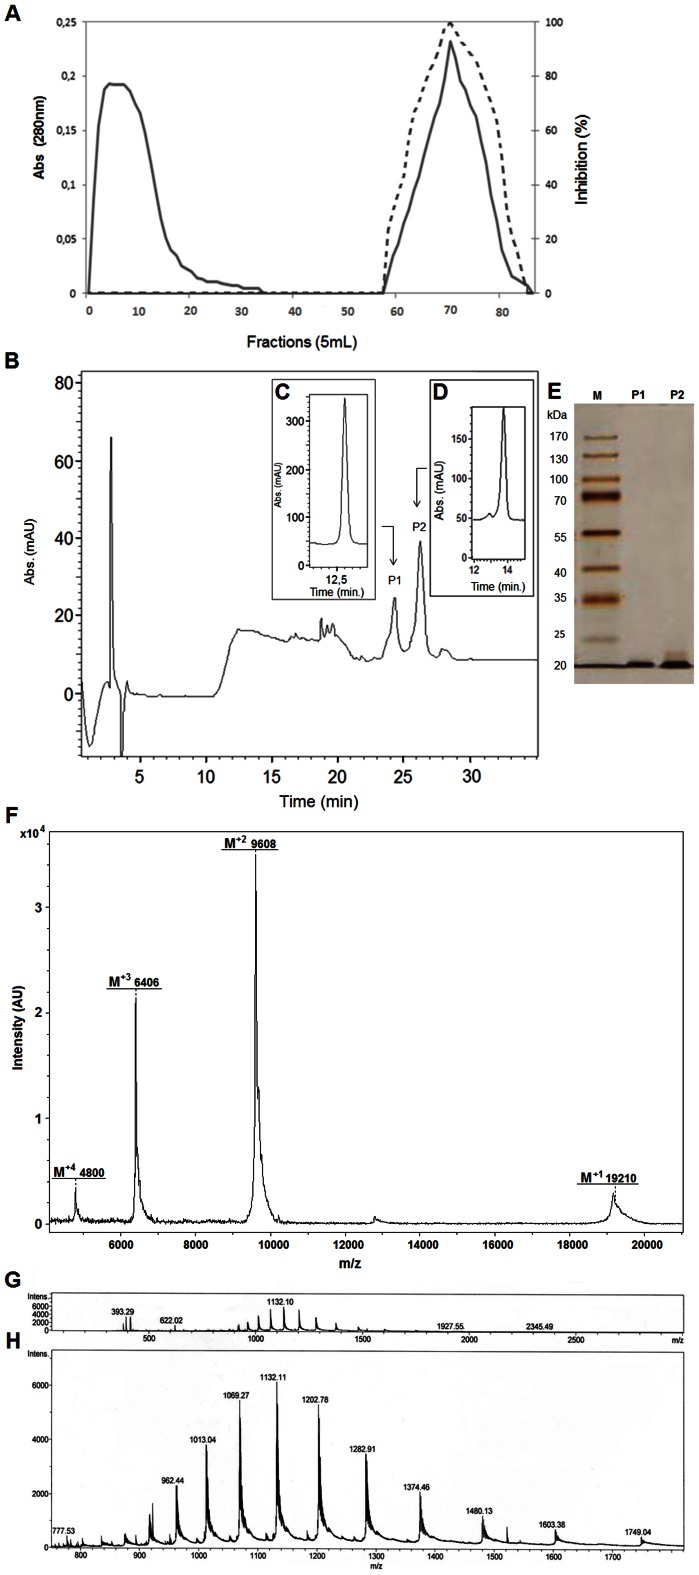
Figure 1. Affinity chromatography on Trypsin-Sepharose of 30–60% ammonium sulfate fraction from E. velutina and reversed-phase chromatography of the Trypsin-Sepharose eluates.
A. Elution profile of the fraction saturated with 30–60% ammonium sulfate from seed extracts of E. velutina. Adsorbed proteins were monitored at 280 nm (―).Inhibitory activity on trypsin (----) was assayed using 50 µL of retained material. B. Elution profile in a reversed-phase column of the retained Trypsin-Sepharose fraction (RT). C and D. Analytical profile of reversed-phase purified trypsin inhibitors. E. Electrophoresis on polyacrylamide gel at 12.5% after developing with silver nitrate. M, Molecular mass markers; EvTI, reversed-phase P1 and P2. F. MALDI Mass spectrometry analysis of EvTI highlighting doble, triple and quadruple charge for molecular mass average of inhibitor. G and H, ESI profile with EvTI overview and zoon analysis showing various inhibitor charges.

