
Figure 1.
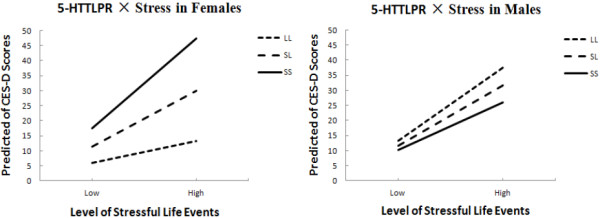
The predicted slope between stress and depressive symptom for different genders and genotypes. The high/low levels of stressful life events meant 1.5 within-subject standard deviation above/below individual’s mean level of stress. Predicted scores of CES-D were calculated by high/low stress scores using HLM. Females with one or two S alleles had significantly higher CES-D scores with high level of life events (left panel); but there were no association between life events and 5-HTTLPR predicting depressive symptoms for males (right panel).