
Figure 3.
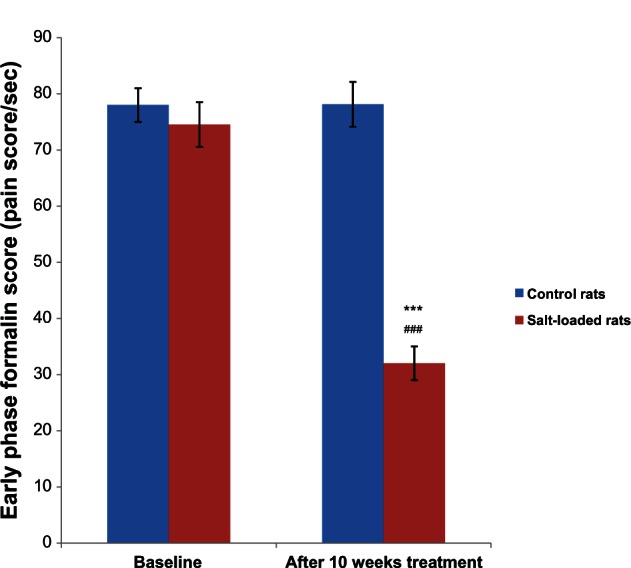
Effects of salt-loading hypertension on the early phase formalin score in rats.
Notes: Values are expressed as mean ± standard error of the mean (n = 6); ***P < 0.001 versus control, ###P < 0.001 versus baseline.
Official websites use .gov
A
.gov website belongs to an official
government organization in the United States.
Secure .gov websites use HTTPS
A lock (
) or https:// means you've safely
connected to the .gov website. Share sensitive
information only on official, secure websites.
Effects of salt-loading hypertension on the early phase formalin score in rats.
Notes: Values are expressed as mean ± standard error of the mean (n = 6); ***P < 0.001 versus control, ###P < 0.001 versus baseline.