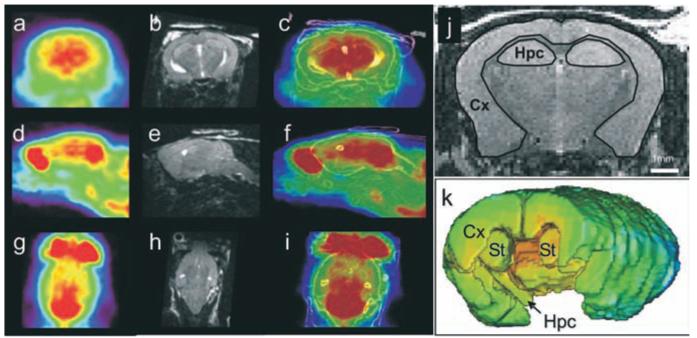
Figure 1.
[18F]-FDG-μPET images from a 12-month-old APP/PS1 mouse in the coronal (a), sagittal (d) and horizontal (g) directions. MRI images of the corresponding animal are shown in b, e and h. Registered PET and brain structure contours extracted from MRI images are shown in c, f and i. Examples of regions of interest outlined on a MRI slice are shown in j. Regions of interest were outlined on several slices from the whole brain. Three-D volumes showing the regions of interest are displayed in k. Cx: Cortex; Hpc: Hippocampus; St: Striatum.

