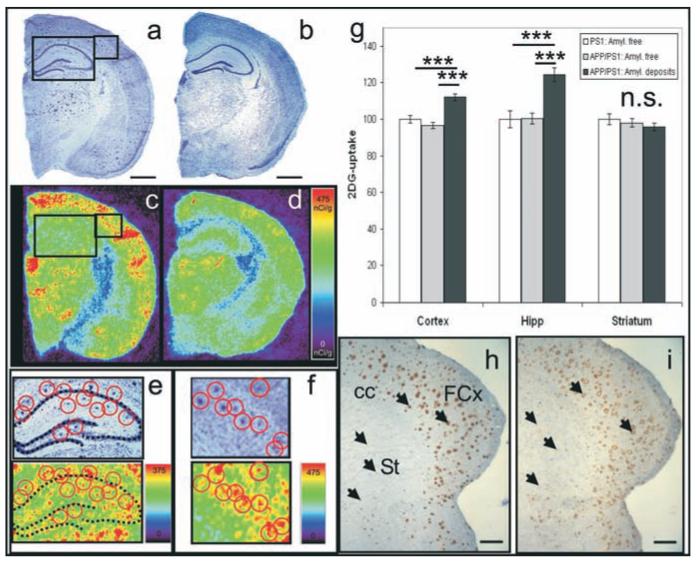
Figure 5.
Evaluation of metabolic activity in brain regions containing amyloid plaques in 12-month-old APP/PS1 mice and control tissue from APP/PS1 and PS1 mice. (a, b) Nissl stain sections from APP/PS1 (a) and PS1 (b) mice (n=3-4 per group). Insets outlined in a correspond to magnified Nissl stain sections in e and f. Amyloid plaques were visible on sections from APP/PS1 mice (a; red circles in e and f). Autoradiographic images corresponding to the same sections are shown in c, d, e, and f. In the autoradiographic section in e and f, an increased glucose uptake is seen within the regions where plaques were present (red circles). (g) Increased glucose uptake is observed in the cortical and hippocampal regions containing amyloid plaques from APP/PS1 mice as compared to amyloid free regions from APP/PS1 or PS1 mice (ANOVA and post-hoc analysis, *** p<0.0001). (h-i) amyloid plaques (h-arrows; 4G8 staining) and activated microglia (i-arrows; IBA1 staining) in the frontal cortex (FCx) and striatum (St) of a 12-month-old APP/PS1 mouse. In the striatum, the density and maturity of amyloid plaques and associated activated microglia were low as compared to those observed in the cortex or hippocampus. Other annotations: cc: Corpus callosum. Autoradiographic scales are in nCi/g. Scale bars = 1mm in a, b; scale bars = 500μm in h, I.

