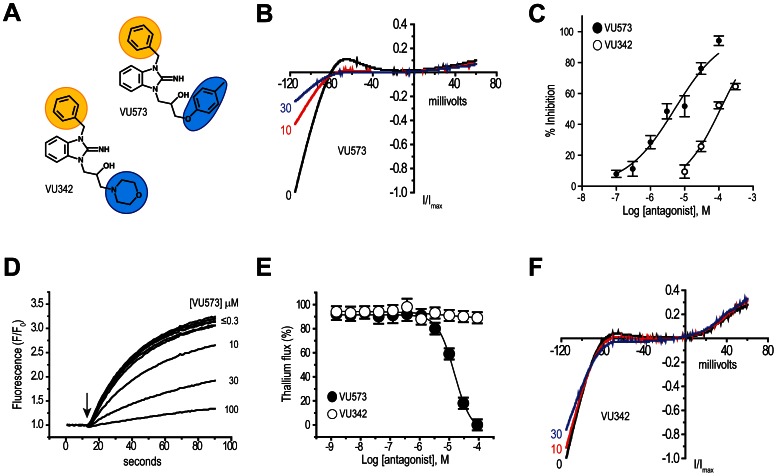
Figure 1. Small-molecule probes of AeKir1 expressed in T-REx-HEK-293 cells.
(A) Chemical structures of the AeKir1 antagonist VU573 and inactive analog VU342. The ‘northern’ and ‘southern’ groups are indicated by yellow and blue shading, respectively. (B) Normalized AeKir1 current-voltage (I–V) relationships illustrating VU573-dependent inhibition at 0, 10, and 30 µM. Cells were voltage clamped at −75 mV and ramped between −120 mV and +60 mV. (C) Concentration-response curves of VU573 (filled circles) and VU342 (open circles) derived from patch clamp experiments (n = 4–9). The IC50 of VU573 and VU342 are 5.14±1.2 µM and 112±1.1 µM, respectively. (D) Dose-dependent inhibition of the AeKir1-mediated Tl+ flux by VU573 ranging in concentrations from ≤0.3 to 100 µM. The arrow indicates when Tl+ was added to the extracellular bath. (E) Concentration-response curves of VU573 (filled circles) and VU342 (open circles) derived from Tl+ flux assays. n = 2–3 independent experiments, each performed in triplicate. (F) Representative I–V relationships showing minimal effects of VU342 on the AeKir1-mediated currents at concentrations of 0, 10, and 30 µM. Values in panels C and E are means ± SEM.

