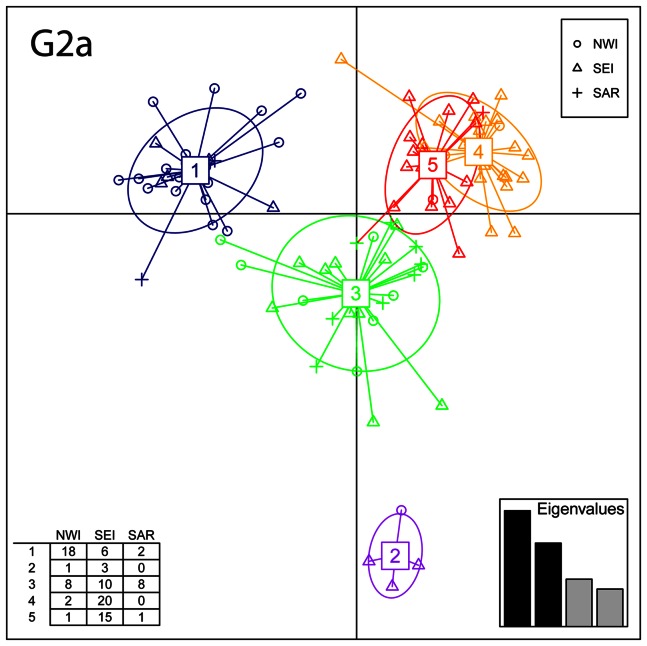
Figure 2. Discriminant Analysis of Principal Components (DAPC) for G2a-P15 haplotypes.
Samples are grouped according to their affiliation at the sPCA-identified groups (NWI; SEI; SAR; symbols in the top right table). The table in the bottom left shows the number of haplotypes in each of the five G2a clusters and their geographical distribution in the three Italian areas. DAPC eigenvalues are depicted in the enclosed barplot.

