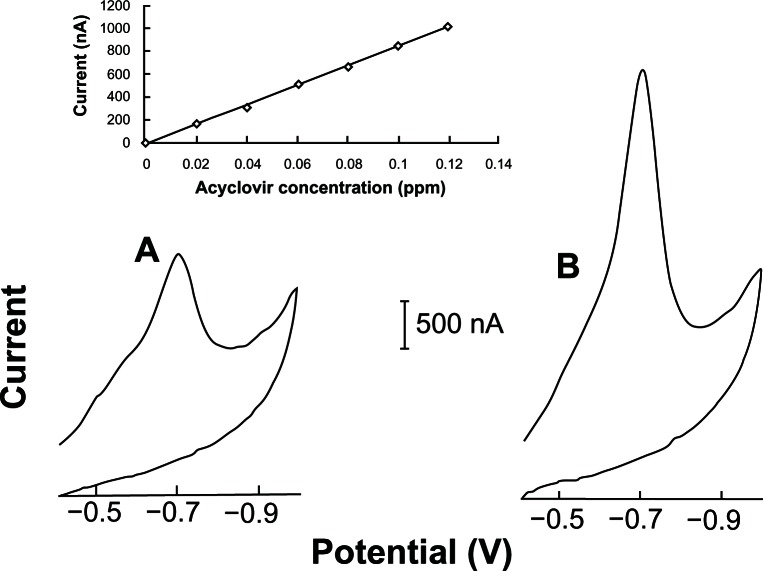
Figure 7.
Linear cyclic scan adsorptive stripping voltammograms obtained after increasing the acyclovir concentration in a solution of 2.0 × 10⁻³ mol L−1 NaOH (with 1% v/v of ethylic alcohol). The (A and B) curves are relative to 0.07 and 0.14 ppm of acyclovir concentration, respectively.
Notes: Accumulation time, 60 seconds at −0.40 V. Condition time, 60 seconds at −0.9 V. Scan rate, 50 mV s−1. Final potential at −1.0 V. Equilibrium time, 30 seconds. Thin-film mercury electrode (5 minutes at −0.9 V). Also shown is the resulting calibration curve plot (0.02–0.12 ppm).

