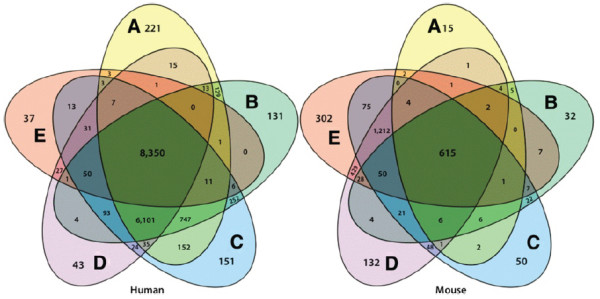
Figure 3.

Detection by both technologies. Symmetrical Venn-diagrams of CCDS ID’s detected by both RNA-Seq and microarrays in human and mouse. ‘A’ is the 100% human sample, ‘B’ is the 75% human and 25% mouse sample, ‘C’ is the 50% human and 50% mouse sample, ‘D’ is the 25% human and 75% mouse sample, and ‘D’ is the 100% mouse sample. The middle region is the number of CCDS IDs that are detected across all samples.
