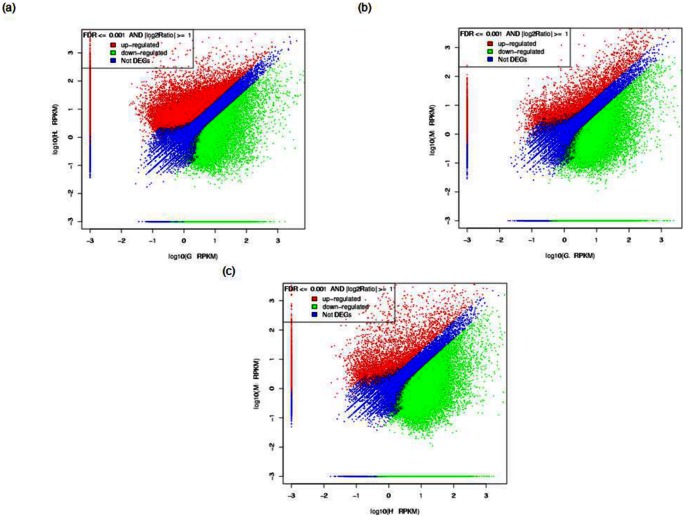
Figure 5. Digital gene expression in two tissues with the following labels: G – Gill, H – Hepatopancreas, M – Healthy Muscle.
Each point represents a unigene. The x and y-axis are the log10 of the normalized expression level (RPKM) of unigene in the indicated tissue. Red and green points indicate significant change at the absolute value of log2 (RPKM ratio in two tissues) ≥1 and FDR = 0.001. Red points indicate up-regulated unigenes and green points indicate down-regulated unigenes in the tissues in which its expression level is represented by the y-axis. Blue points indicate insignificant differentially expressed unigenes. (a) Expression level of unigenes in G versus H, (b) Expression level of unigenes in G versus M and (c) Expression level of unigenes in H versus M.

