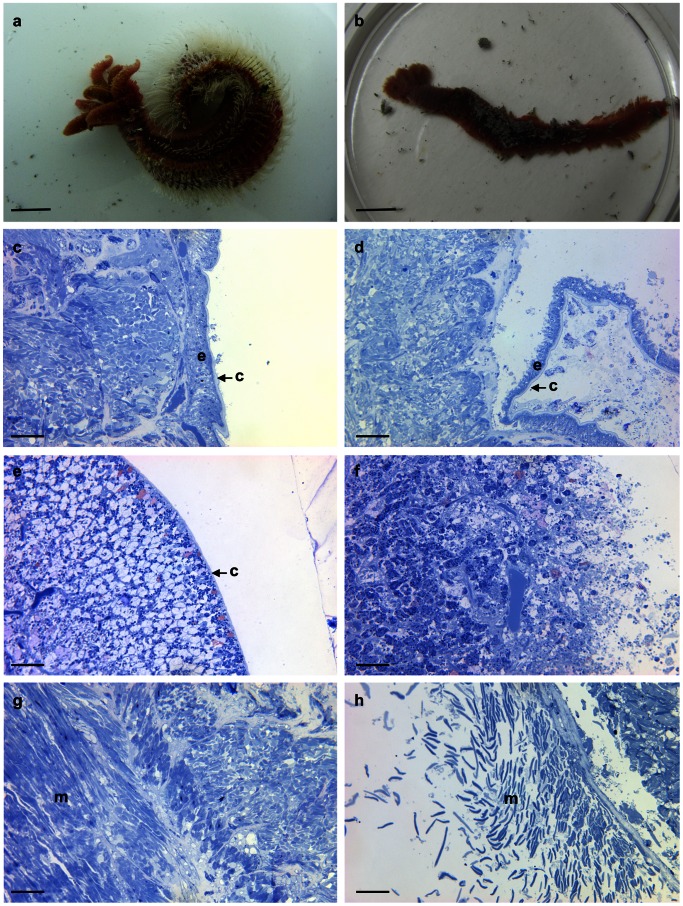
Figure 4. Morphological consequences of a 55°C-exposure in A.
pompejana .°C-exposed (left column) versus 55°C-exposed (right column) specimens. a, b, General view of specimens after the in vivo experiments; c, d, Sections of the dorsal region showing the delamination of the epidermis (e) and cuticle (c) at 55°C; e, f, Sections of the ventral tube secreting region showing the disappearance of the tegument and disorganization of the underlying tissues at 55°C; g, h, Sections of muscles (m) showing the disorganization of cells at 55°C. Bar represents approximately 1 cm in a, b and 50 µm in c-h.

