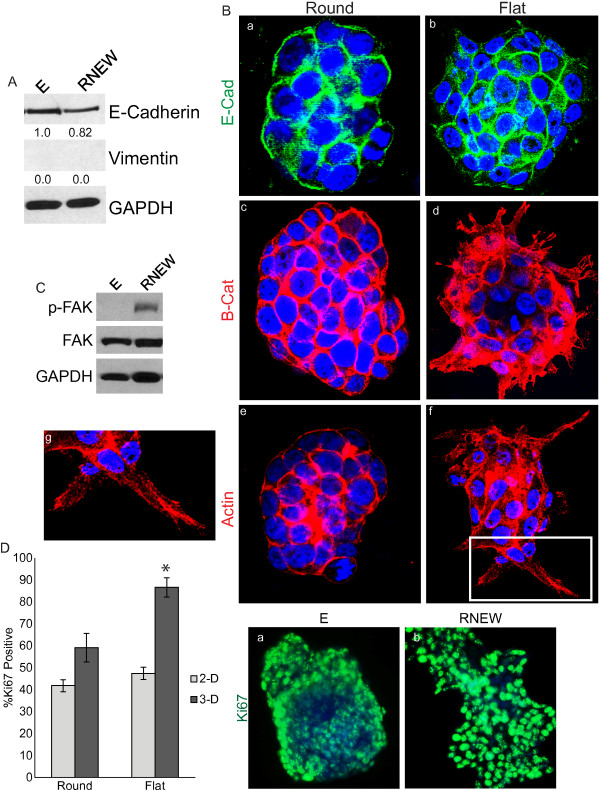
Figure 5.
Invasive characteristics at the edge of the flat disc-like colonies. A) Western blots of E-cadherin and vimentin. HCT-116 cells were grown in 3-D matrigel with E or RNEW media for 6 days. Cells were then lysed and subjected to Western blot analysis to determine the levels of E-cadherin and vimentin as described in Materials and Methods. GAPDH was used as a loading control. Densitometry shown below each protein. B) Confocal images of round or flat colonies of HCT-116 cells grown in 3-D with E or RNEW media for 6 days. a, c, and e: round colonies; b, d, f, and g: flat colonies; a-b: E-cadherin merged with DNA; c-d: β-catenin merged with DNA, and e-g: actin merged with DNA, g: zoom of image f. C) Western blots of total and phospho-FAK. HCT-116 cells were grown in 3-D matrigel for 6 days with E or RNEW media. Cells were then lysed and subjected to Western blot analysis to determine the levels of total and phospho-FAK as described in Materials and Methods. GAPDH was used as a loading control. D) Quantitation and images of Ki67 positive cells. HCT-116 cells were grown in 2-D or 3-D conditions with E or RNEW media for 6 days, stained for Ki67 and DNA and the percentage of Ki67 positive cells was assessed by immunofluorescence. Results are expressed as mean percentage of Ki67 positive cells, +/− SEM, n=3. Fluorescent images of HCT-116 cells grown in 3-D with (a) E or (b) RNEW media for 6 days. Cells were stained for DNA (blue) and Ki67 (green).

