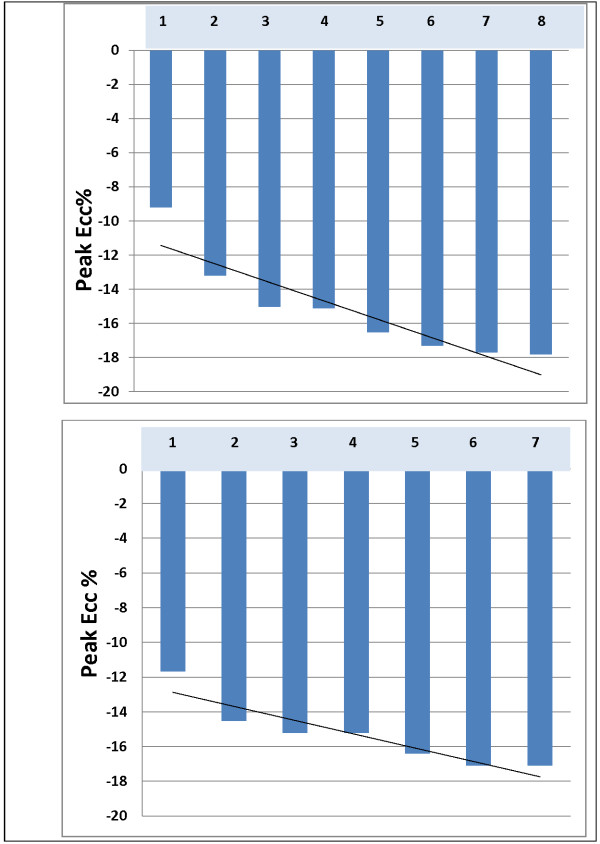
Figure 6.
Whole heart tagging. Slice 1: Most basal; slice (7) 8: Most apical. Top: Volunteer 1 (44-yr-old healthy male) and Bottom: Volunteer 2 (42-yr-old healthy male) with whole heart tagging. As seen in the figure, LV Ecc progressively increases from base to apex and the difference in LV Ecc between the slices is more pronounced in most basal slices compared to the rest of the heart.

