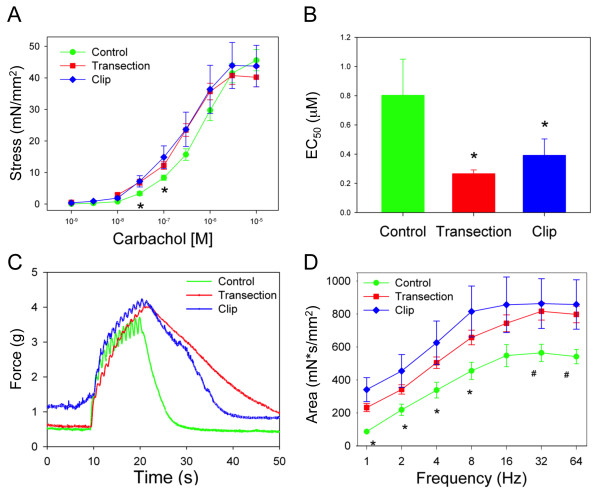
Figure 5.
Enhanced cholinergic sensitivity in detrusor tissue strips from injured rats versus controls. (A) Dose–response curves for carbachol in control, TX and CX bladders. *, control significantly lower than TX and CX, p < 0.05. (B) EC50 values generated from concentration-dependent carbachol contractions in bladder tissue from control, TX and CX. *, significantly lower than control, p < 0.05. (C) Original representative tracings from each group showing contractile responses to EFS at a frequency of 1 Hz. Stimulation began at 10 sec and terminated at 20 sec. Data represent mean ± SEM. (D) Frequency-response curves for EFS expressed as area of contraction. *, significantly lower than TX and CX, p < 0.05; #, significantly lower than TX, p < 0.05.

