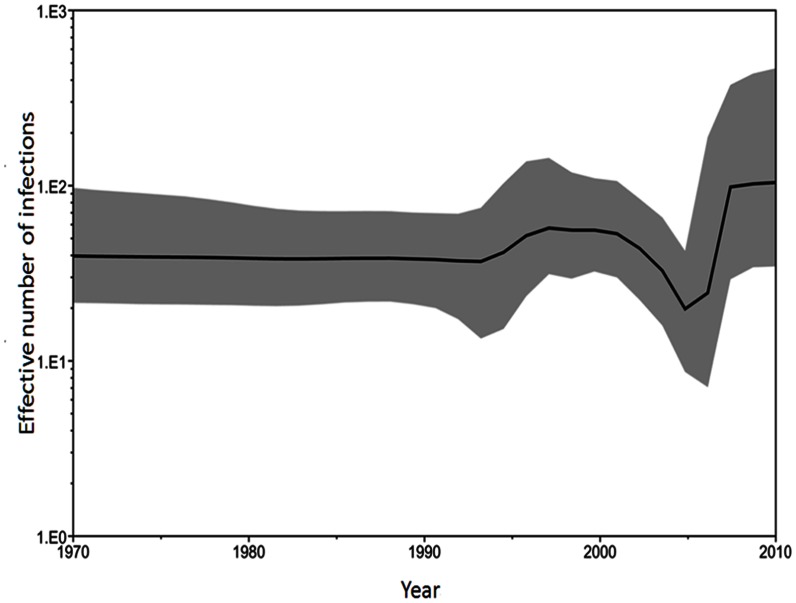
Figure 3. Bayesian skyline plot derived from alignment of the RSV partial F gene sequences in Taiwan.
The x axis is in units of years before 2010, and the y axis represents the effective population size of the virus (i.e. the number of genomes effectively contributing to the next generation). The thick solid black line is the estimated median, and the pale gray areas show the upper and lower bounds of the 95% HDP interval.

