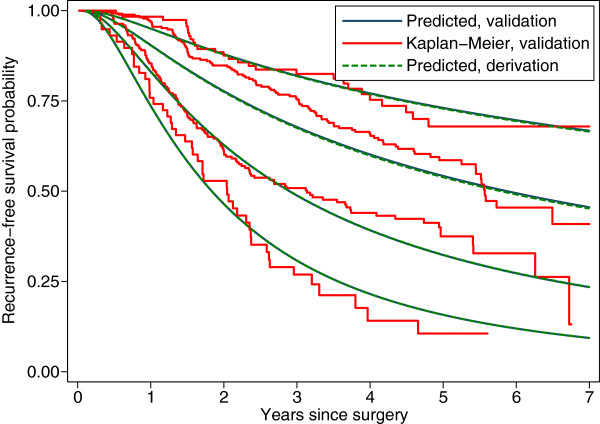
Figure 4.
Calibration of survival probabilities in the validation dataset. Smooth lines: recurrence-free survival as predicted in the derivation and validation datasets from the PI and the smoothed baseline survival function from the derivation dataset. Jagged lines: Kaplan-Meier estimates in the three risk groups in the validation dataset. Note that the pairs of smooth curves for the two highest risk groups happen nearly to coincide and are visually indistinguishable.

