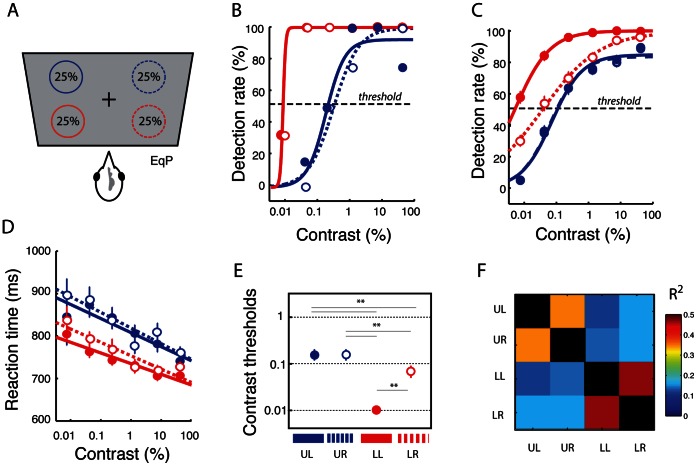
Figure 2. A lower visual field advantage for target detection.
A. Targets were presented with equal probability (25%) in each of the four visual quadrant locations. B. Contrast-response functions showing the effect of target contrast on detection rates for a single bird (bird #2) measured within a single experimental session in the EqP condition. Target contrasts were log-transformed and binned at equal intervals. Circles: mean detection rates for target contrasts within each bin. Lines: sigmoidal fits. Blue circles: upper hemifield data. Red circles: lower hemifield data. Solid lines and filled circles: left hemifield data. Dotted lines and open circles: right hemifield data. Dashed horizontal line: threshold detection rate (50%). C. Summary data showing contrast-response functions of target contrast based on detection rates in the EqP condition (n = 88 experiments in 3 birds). Error bars: standard error of the mean (SEM) across experimental sessions. Other conventions are the same as in (B). D. Summary data showing mean reaction times as a function of target contrast in the EqP condition (n = 88 experiments in 3 birds). Blue circles: mean reaction times for targets in the upper visual quadrants. Red circles: mean reaction times for targets in the lower visual quadrants. Lines: linear fits. E. Mean contrast thresholds for the different visual quadrants in the EqP condition (n = 88 experiments in 3 birds). Circles: mean threshold values. These values, obtained by averaging contrast thresholds derived from sigmoidal fits to individual test session data, are similar to the contrast thresholds derived from sigmoidal fits to the mean data across test sessions, shown in (C). Error bars: standard error of the mean (SEM) across experimental sessions. Thin grey lines with asterisks: p<0.01 for the difference in contrast thresholds (ANOVA). Dashed horizontal lines indicate specific contrast values. F. Pair-wise correlation matrix (R2 values) of the detection thresholds across test sessions among the four visual quadrants. Warmer colors correspond to higher correlations (legend). Correlations along the diagonal are all unity (black).

