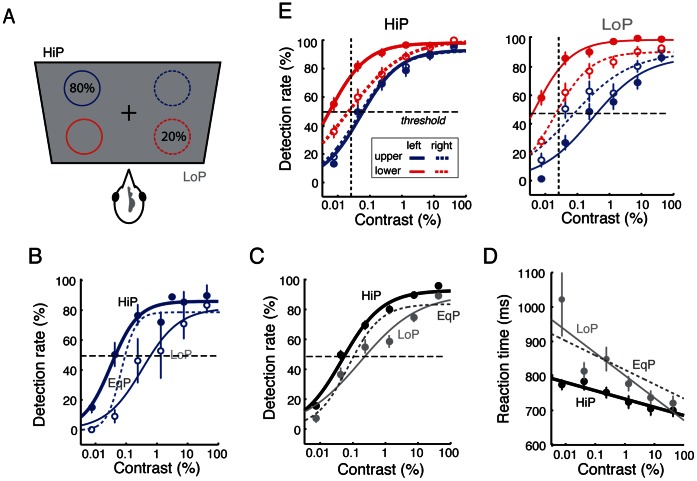
Figure 3. Higher target spatial probability improves detection performance in the upper hemifield.
A. Stimulus configuration for modulating target spatial probability. In a test session, targets were presented with 80% probability at a location in one of the four quadrants (high-probability, HiP, black) and with 20% probability at the opposite location (low-probability, LoP, grey). In the next session, locations of HiP and LoP presentation were interchanged. B. Detection rates for upper hemifield targets from a representative bird. HiP detection rates: thick blue line; LoP detection rates: thin blue line. The contrast-response curve for the EqP condition (dotted line) from the same bird is shown for reference. C. Population summary data for detection rates of upper hemifield targets under each condition. HiP: black data; LoP: grey data. Lines: sigmoidal fits. The contrast-response curve for the EqP condition (dashed sigmoidal fit) is shown for reference. Other conventions are the same as in Figure 2C. D. Summary data showing mean reaction times as a function of target contrast in the HiP and LoP conditions. Lines: linear fits. Other conventions are same as in (C). E. (Left) Detection rates for targets in the four visual quadrants when the probability of presentation was high (80%, HiP) at that location. Dashed horizontal line: threshold detection rate (50%). Dashed vertical line: threshold detection contrast (0.025%). Other conventions are the same as in Figure 2C. (Right) Same as the left panel, except that detection rates were measured when the probability of presentation was low (20%, LoP) at that location. Contrast-response curves for the HiP condition were considerably more clustered compared to those for the LoP condition.

