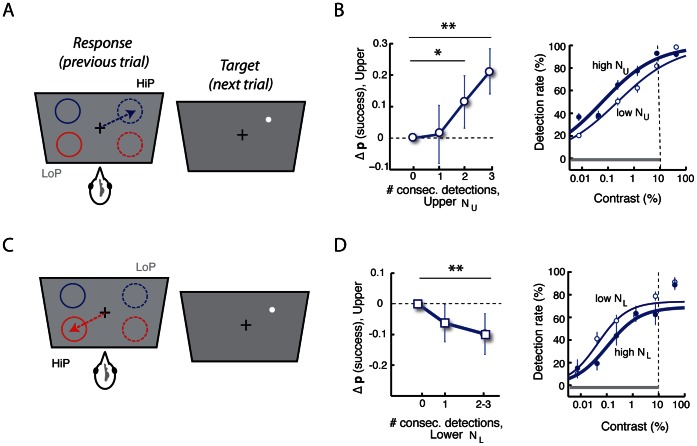
Figure 4. Target detection performance depends on recent history of detections.
A. Task configuration for analyzing target detection performance in an upper quadrant as a function of the number of consecutive detections in the same quadrant. B. (Left) Change in the probability of detecting targets in the upper quadrants following 0,1, 2 or 3 consecutive successful detections (NU) in the same quadrant. After matching target contrasts (grey bar in right panel), the probability of a successful detection in the HiP quadrant increased significantly with more consecutive detections in the same quadrant (** p<0.01; * p<0.05, bootstrap test). Error bar: jackknife standard error. (Right) Contrast-response functions (detection rates) for targets following 0 (thin line) or 1–3 consecutive detections (thick line) in the same quadrant. C. Task configuration for analyzing target detection performance in an upper quadrant as a function of the number of consecutive detections in the opposite quadrant. D. (Left) Change in the probability of detecting targets in the upper quadrants following 0, 1 or 2–3 consecutive successful detections (NL) in the opposite quadrant. (Right) Contrast-response functions (detection rates) for upper hemifield targets following 0 (thin line) or 1–3 consecutive detections (thick line) at the opposite (lower hemifield) quadrant. Other conventions are the same as in (B).

