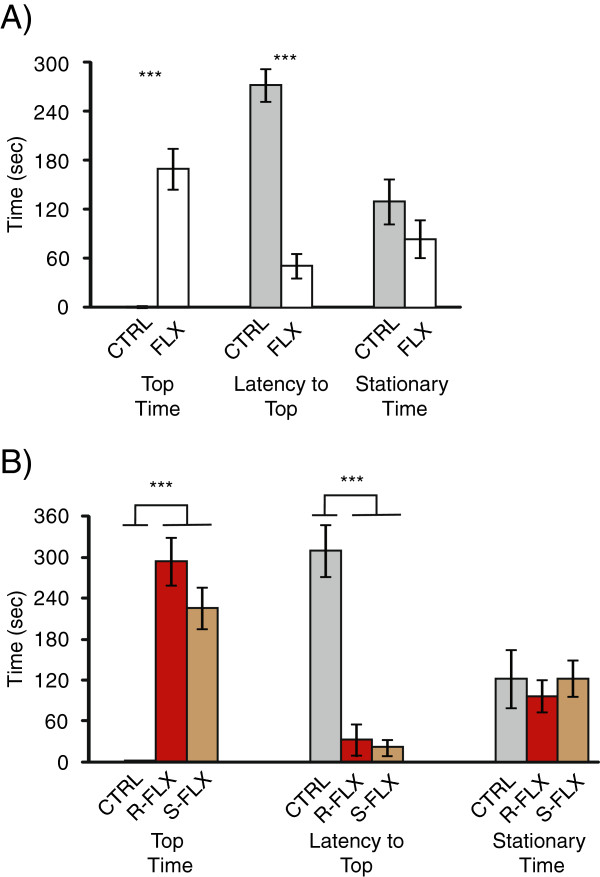
Figure 1.
Behavioral measures after drug treatment. A) Amount of time spent in the top half of the tank, latency to the top half of the tank and stationary behavior for fish treated with racemic fluoxetine (white) or controls (grey). B) Amount of time spent in the top half of the tank, latency to the top half of the tank and stationary behavior for fish treated with R isomer (red), S-isomer (brown) or control (grey). Error bars represent standard error. *, p < 0.05; **, p < 0.01; ***, p < 0.001.

