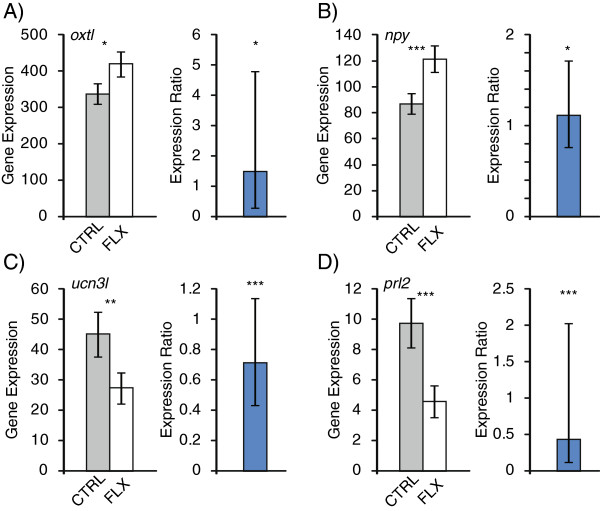
Figure 2.
RNA-sequencing and qRT-PCR expression of select genes with racemic fluoxetine treatment. Gene expression of (A) isotocin, (B) neuropeptide Y, (C) urocortin 3, and (D) prolactin. In each panel left and right graphs represent quantification from RNA-sequencing (fragments per kilobase per million reads, FPKM) and qRT-PCR (expression ratio: gene expression in fluoxetine treatment / control), respectively. qRT-PCR gene expression was normalized to a housekeeping gene. Grey and white bars represent control and fluoxetine treatment, respectively. Error bars represent 95% confidence intervals. *, p < 0.05; **, p < 0.01; ***, p < 0.001.

