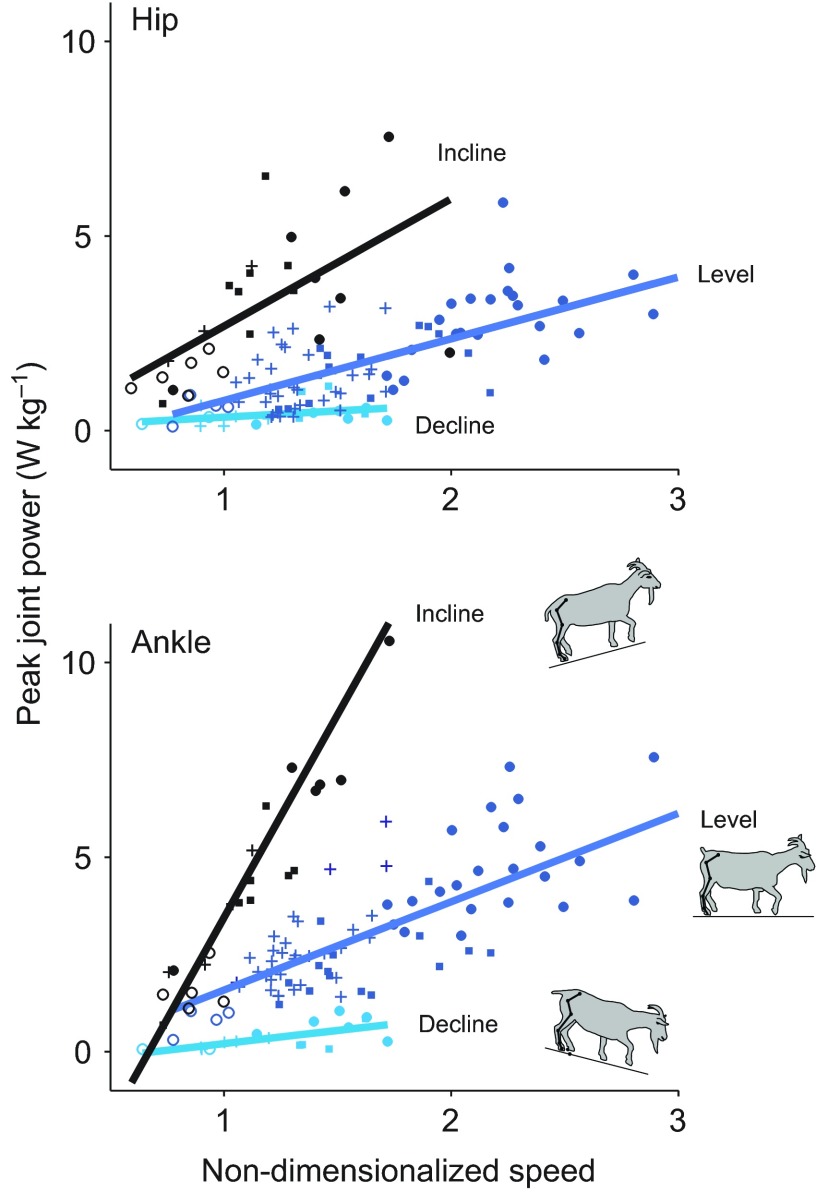
Fig. 9.
Peak power (i.e. peak rate of energy generation) at the hip and ankle on the level, inclined and declined runways plotted versus the goats' non-dimensionalized speeds. Peak power increased with both speed and surface grade, particularly at the ankle. Lines show the best-fit linear regressions, and symbols indicate gait type: open circles, walk; crosses, trot; filled squares, trailing-limb gallop; and filled circles, leading-limb gallop.

