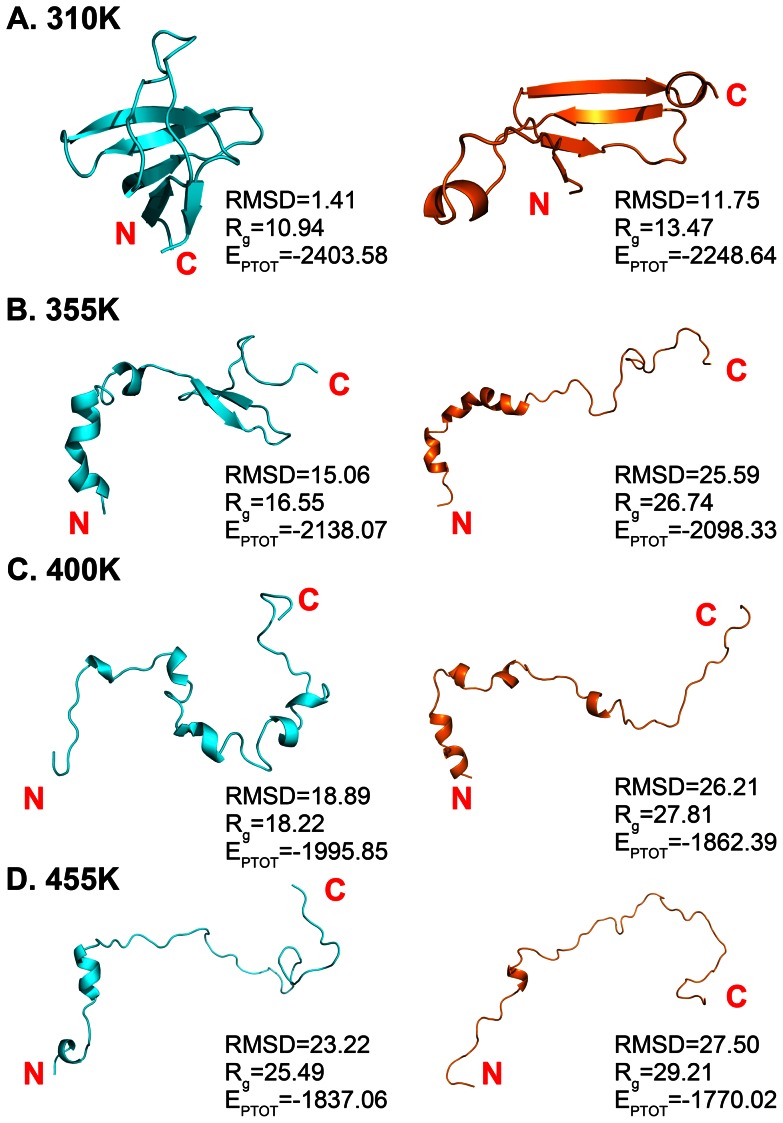
Figure 7. The representative structures of temperature 310 (A), 355 (B), 400 (C), and 455 K (D) for gn and gm systems.
The systems gn and gm are colored with cyan and orange. RMSD respected to the crystal structure, radius of gyration (Rg), and potential energy (EPTOT) of the protein in each cluster are added in this figure, and the units of them are Å, Å, and Kcal/mol, respectively.

