
Figure 3.
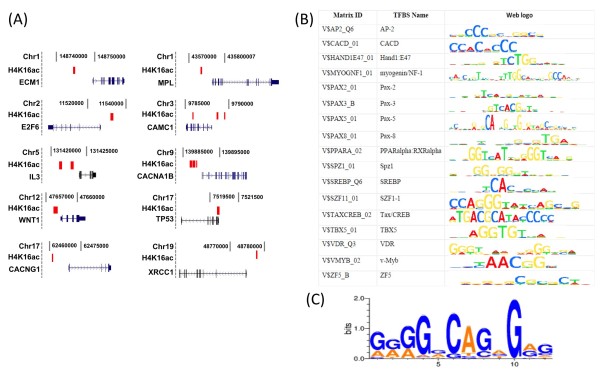
Distribution of H4K16ac in genes and its associated sequences. (A) Position of H4K16ac enriched fragments with respect to TSS (±10 kb of TSS; UCSC hg18) on 10 representative genes from different chromosomes is shown based on ChIP-chip data. (B) Transcription factor binding sites with significant enrichment (p-value <0.0005) within H4K16ac ChIP-chip peaks. Analysis was performed using TRANSFAC. (C) Sequence logo of the motif identified in H4K16ac-enriched DNA fragments.