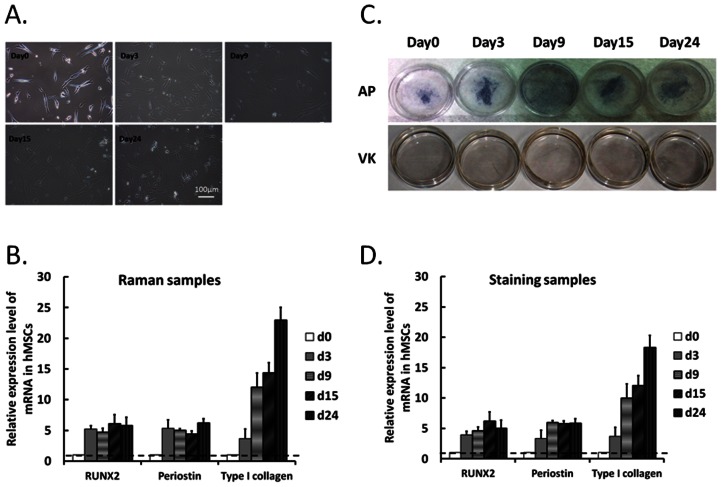
Figure 5.
(A) Micrographs of MSCs treated with osteogenic media for 0, 3, 9, 15 and 24 days. (Scale bar: 100 µm) (B) Gene expression profiles of RUNX2, periostin, and type I collagen were detected in MSCs after Raman measurements by qPCR and normalized by internal and undifferentiated controls. Data are shown as mean ± SE (n = 3). (C) Alkaline phosphatase and Von Kossa staining of MSC-osteoblast differentiation. (D) Gene expression profiles of RUNX2, periostin, and type I collagen in staining samples were detected by qPCR and normalized by internal and undifferentiated controls. Data are shown as mean ± SE (n = 3).

