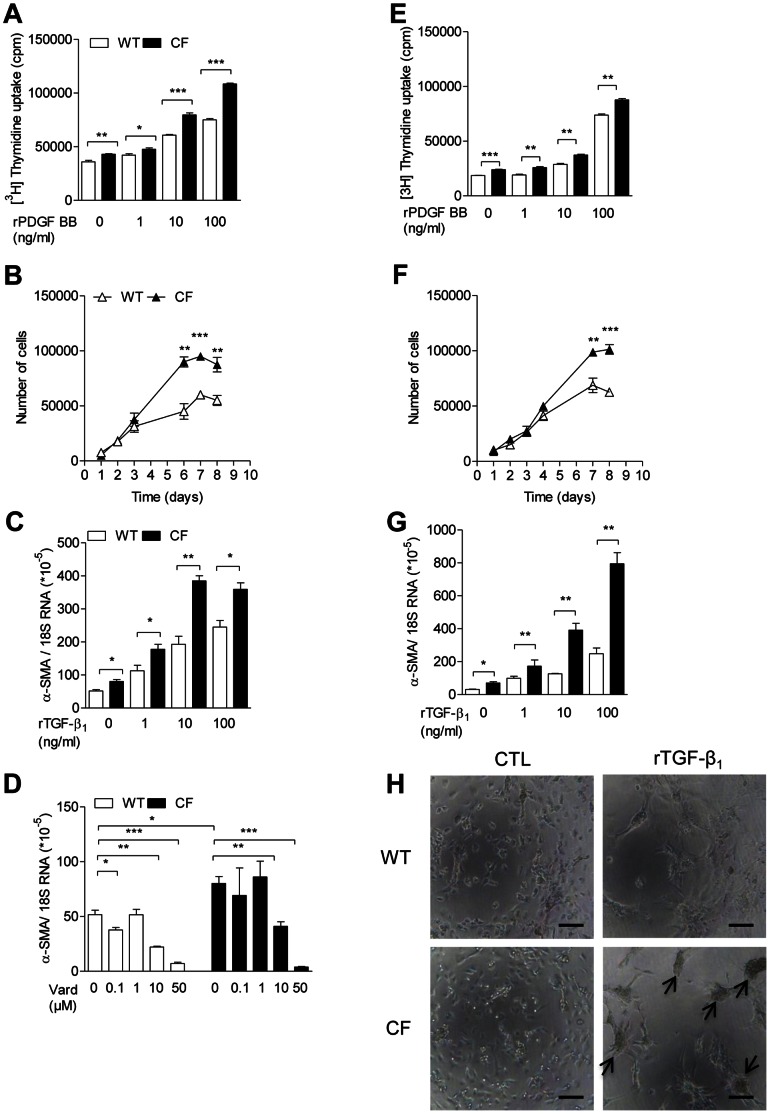
Figure 4. Exaggerated proliferation and myofibroblast differentiation of CF fibroblasts.
Cell proliferation and myofibroblast differentiation in cultured lung (A–D) and skin (E–H) fibroblasts at the second passage purified from CF mice homozygous for the F508del mutation and from wild-type (WT) mice. A,e) Uptake of 3H-thymidine (1 µCi/well) assessed in cultured cells seeded at 30×103 cells/well, in the absence of any added growth factor to culture media or in the presence of 1 to 100 ng/ml human rPDGF-BB for 1 h. After 48 h, adherent cells were trypsinized before 3H-thymidine counting. Data expressed as counts per minute (cpm). b,f) Cell growth analysis assessed by daily counting, in a Neubauer chamber, of trypsinized cells cultured in the absence of any added growth factor to culture media. c,g) α-SMA mRNA expression, using 18S RNA as a reference, assessed in the absence of any added growth factor to culture media or in the presence of 1 to 100 ng/ml human rTGF-β1 for 24 h. d) α-SMA mRNA expression assessed in the presence of 0.1 to 50 µM vardenafil (Vard) for 6 h. h) Micrographs of fibroblast cultures under stimulation with 10 ng/ml human rTGF-β1. Arrows identify formation of cellular aggregates. Bars: 100 µm. Values are means ± SEM of 3 multi(96)well cultures per group from a representative experiment selected from at least 3 experiments with similar results. *: P<0.05; **: P<0.01; *** P<0.001 for comparison of mean values.

