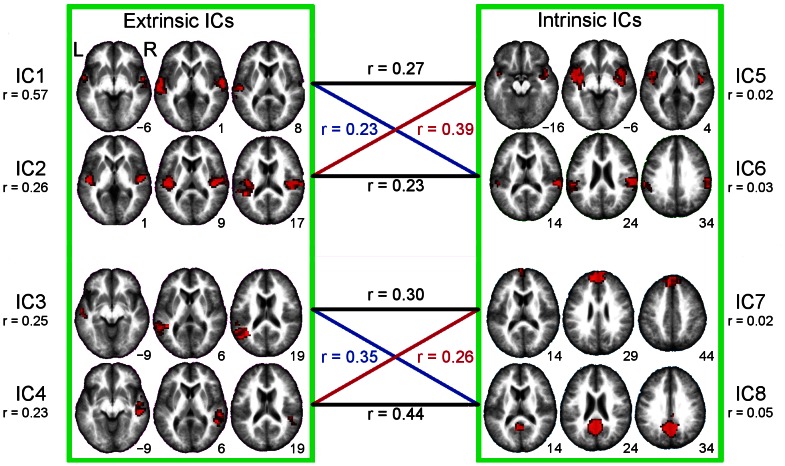
Figure 3. Spatial maps for IC1–IC8.
The extrinsic independent components (ICs), IC1–IC4, are shown on the left and the intrinsic ICs, IC5–IC8 on the right. Extrinsic and intrinsic ICs are grouped with green boxes. Mean intersubject correlation values of the ICs time-courses are written below the IC number. Correlation values between the extrinsic and intrinsic ICs are displayed in the middle. The group-level t-maps are thresholded at FWE corrected p<0.01, cluster size >20 voxels and overlaid on an average of the subjects’ normalized anatomical images. MNI z-coordinates are presented beside the axial slices. L = left, R = right, r = mean Pearson correlation strength.

