
Fig. 8. Cellular TNF-α in NR8383 and Caco-2 cells after 24 h exposure to.
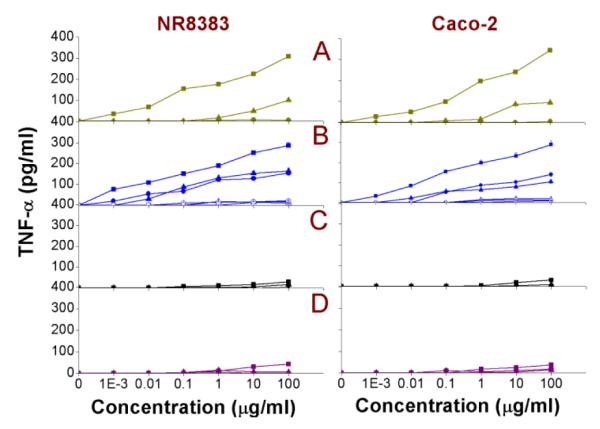
(A) Si(1.6) NP-NH2 ( ), Si(1.6) NP-N3 (
 ) and Si(1.6) NP-COOH (
 ); (B) SiFe(3.9) NP-NH2 (∎), Si(3.9) NP-NH2 (▴), SiMn(3.9) NP-NH2 (●), SiFe(3.9) NP-NH2-Dex (
 ), Si(3.9) NP-NH2-Dex (
 ) and SiMn(3.9) NP-NH2-Dex (
 ); (C) Ge NP-TMPA (∎), Ge NP-PEG (▴) and Si NP-PEG (●); (D) Si NP-Sil (
 ), Si NP-UDA (
 ) and Si NP-Pol (
 ). Results are shown as mean ± SEM (n=3).