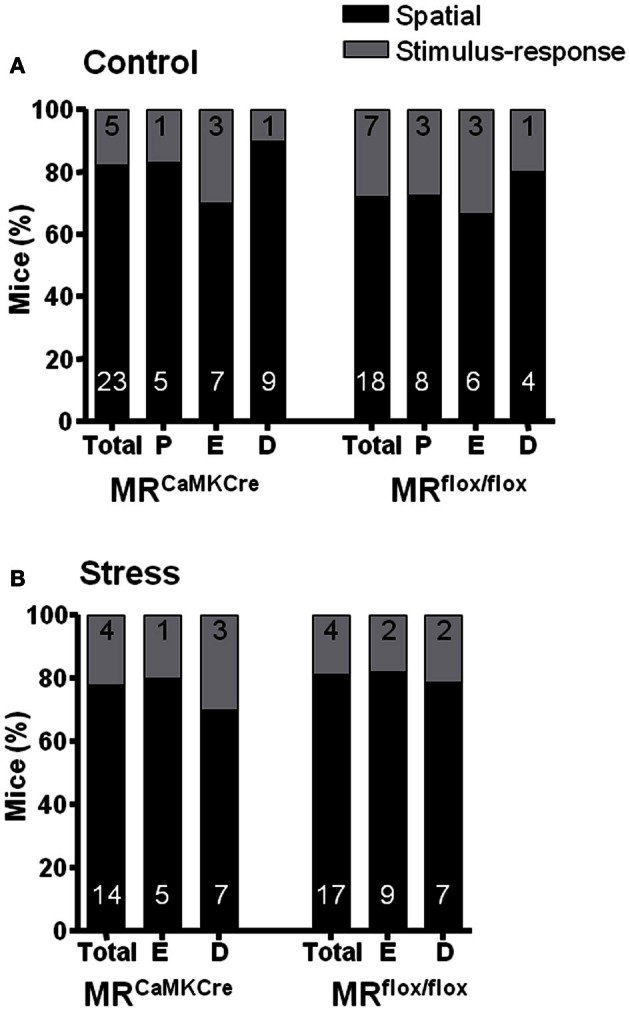
Figure 3.

Percentage of mice using Spatial or Stimulus-response strategies revealed by the test trial. No effect of the estrous cycle on strategies in (A) control and (B) stressed mice. Numbers in the bars represent the number of mice using the strategy. Black bar denotes the spatial strategy and the gray bar the stimulus–response strategy. D, diestrus; E, estrus; P, proestrus.
