Figure 1.

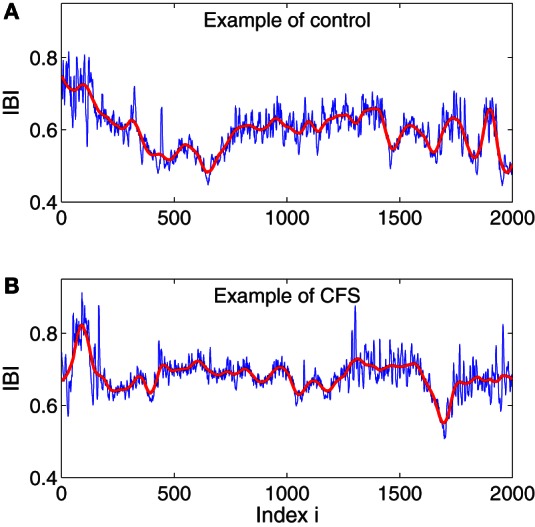
Examples of IBI data for a control (A) and CFS (B) subject. The red curves are the trend signals obtained by the adaptive filter, which will be explained below.

Examples of IBI data for a control (A) and CFS (B) subject. The red curves are the trend signals obtained by the adaptive filter, which will be explained below.