Figure 2.

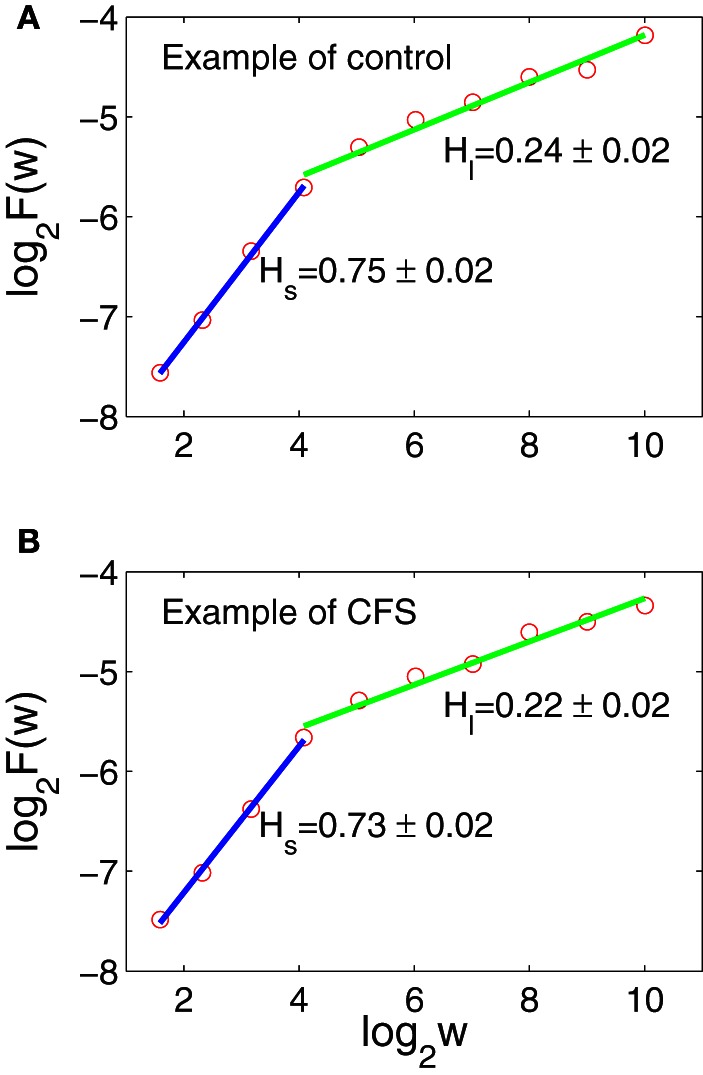
AFA of the IBI data shown in Figures 1A,B. The scaling break around w = 24 is generic among all the subjects. (A,B) The red circles are for computed H, the blue lines are a linear fit for Hs, and the green lines are linear fits for Hl.

AFA of the IBI data shown in Figures 1A,B. The scaling break around w = 24 is generic among all the subjects. (A,B) The red circles are for computed H, the blue lines are a linear fit for Hs, and the green lines are linear fits for Hl.