Figure 3.

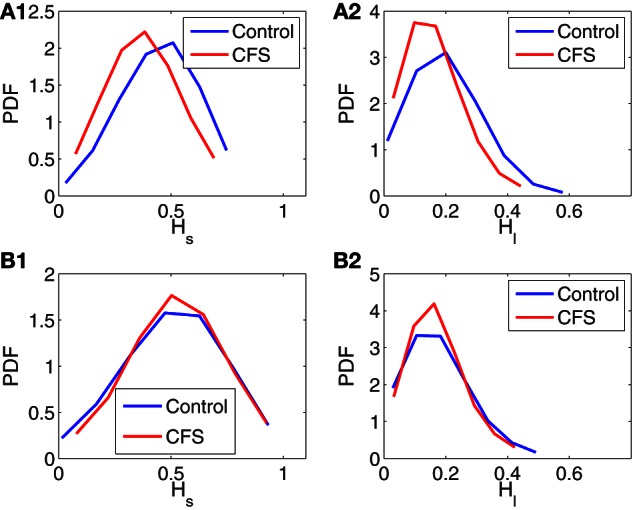
Probability density functions (PDFs) for Hs and Hl of control and CFS subjects, where (A1, A2) are for data measured before the TSST, and (B1, B2) are for data measured during the stress tests.

Probability density functions (PDFs) for Hs and Hl of control and CFS subjects, where (A1, A2) are for data measured before the TSST, and (B1, B2) are for data measured during the stress tests.