Figure 5.

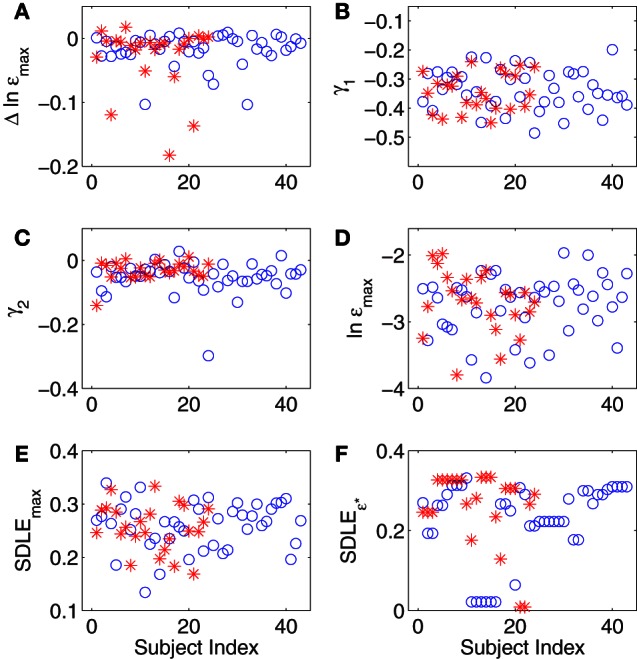
(A–F) Summary of SDLE analysis, where blue circles and red stars are for control and CFS subjects, respectively (see text for more details about each metric).

(A–F) Summary of SDLE analysis, where blue circles and red stars are for control and CFS subjects, respectively (see text for more details about each metric).