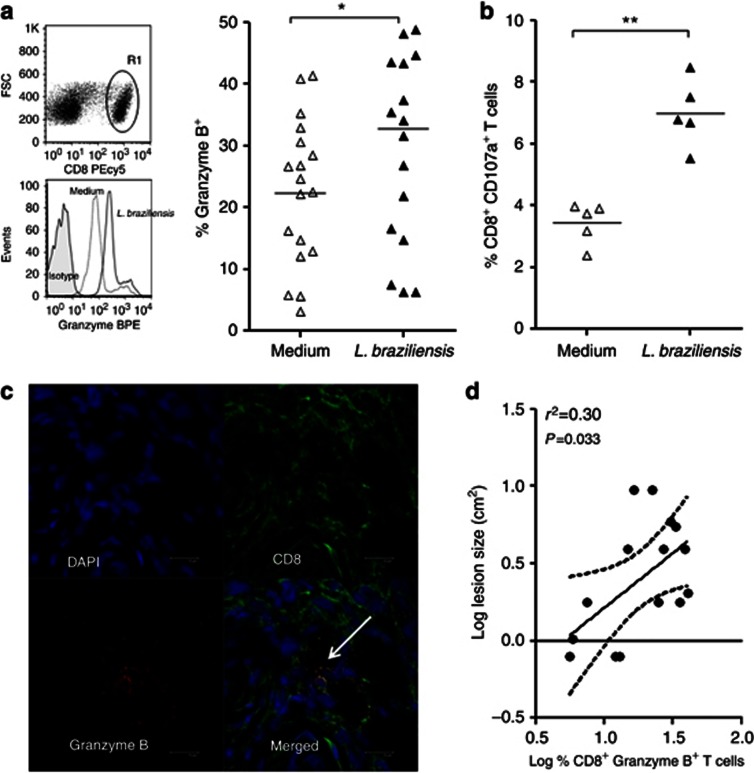
Figure 2.
Expression of cytolytic markers by lesion-derived CD8+ T cells from cutaneous leishmaniasis (CL) patients after stimulation. (a) R1 was analyzed from the CD8 versus forward scatter (FSC) dot plot (top). Histograms are representative of 18 CL patients and the graph displays the frequency of CD8+ T cells expressing granzyme B. (b) Expression of CD107a in CD8 T cells. (c) Representative images from confocal microscopy. 4',6-Diamidino-2-phenylindole (DAPI) counterstained (top left panel); CD8 staining (top right panel); granzyme B staining (bottom left panel); overlay showing expression of granzyme B in CD8+ T cells (white arrow; bottom right panel), bar=10 μm. (d) Correlation analysis between the frequency of CD8+Granzyme B+ T cells and lesion size. *P<0.05, **P<0.01. Statistical comparisons were done using the Mann–Whitney U-test and the Spearman's (r2) rank test. PE, phycoerythrin.

