Figure 3.
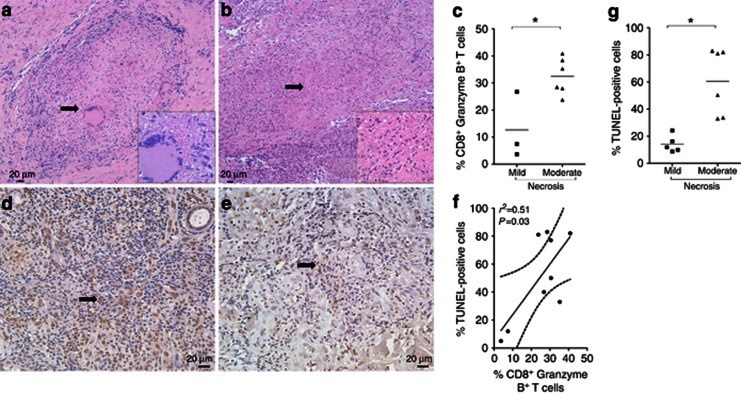
Histopathology and TUNEL-positive cells in cutaneous leishmaniasis (CL) lesions. (a, b) Necrosis scores 1 and 2 showed by arrowhead and inset. (c) Analysis between intensity of necrosis and percentage of CD8+Granzyme B+ T cells. DNA damage in biopsies with (d) higher and (e) lower percentages of TUNEL-positive cells, which are indicated by black arrows. (f) Correlation analysis between the percentage of CD8+Granzyme B+ T cells in the tissue and the percentage of TUNEL+ cells. (g) Analysis between the intensity of necrosis and the number of TUNEL+ cells. Bar=20 μm. *P<0.05. Statistical comparisons were done using the Mann–Whitney U-test and the Spearman's (r2) rank test. Pictures represented a magnification of × 200, insets × 1,000, and TUNEL+ cells × 400.

