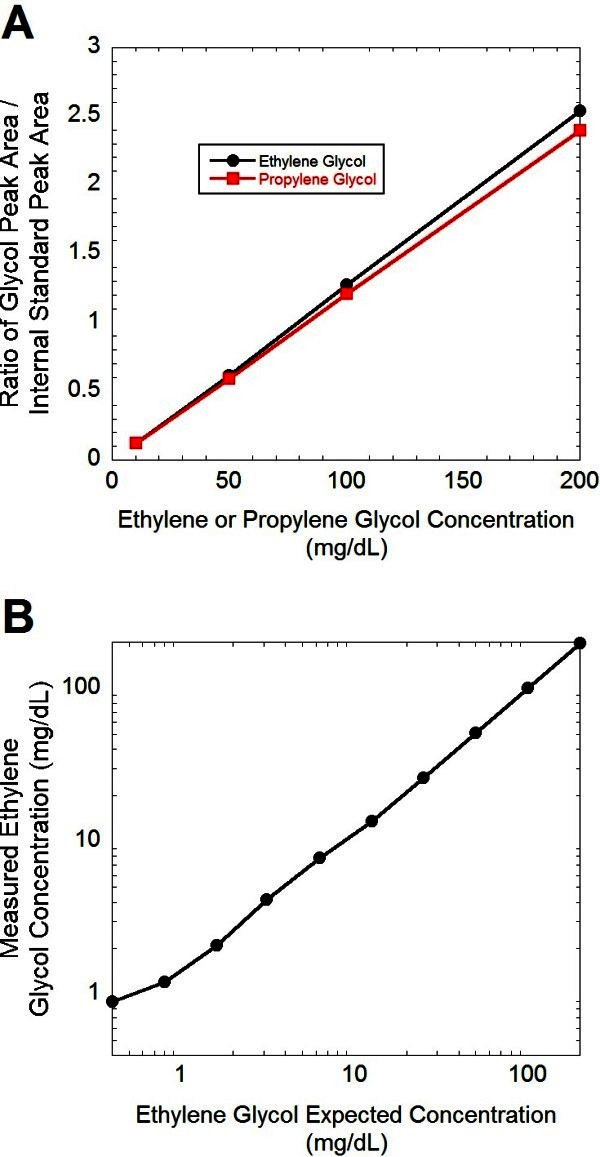
Figure 2.

Linearity plots of HS-GC analysis of ethylene glycol and propylene glycol.A Linearity of ethylene glycol and propylene glycol shown using linear y-axis. B Linearity of ethylene glycol using a logarithmic y-axis for broader view of linearity of method for measurement of ethylene glycol concentrations.
