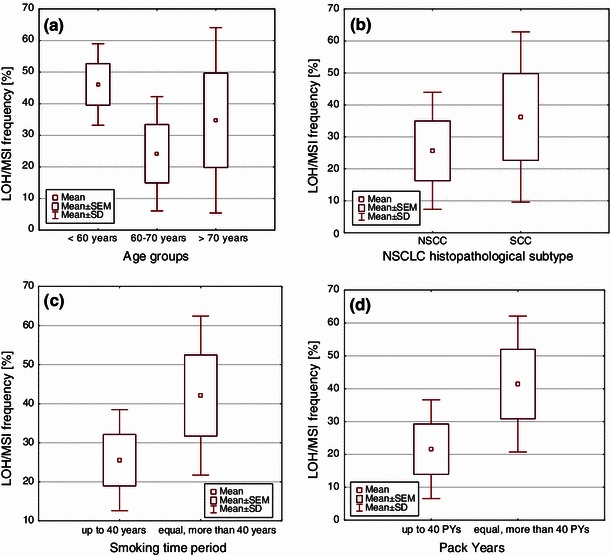
Fig. 3.

Box-and-whisker plots, representing mean LOH/MSI frequencies in the studied groups, according to: a age (p = 0.006, Kruskal–Wallis test); b NSCLC histopathological subtypes (p = 0.007, U Mann–Whitney test); c the period of smoking (p = 0.007, U Mann–Whitney test); d PYs (number of cigarettes smoked in a lifetime) (p = 0.004, U Mann–Whitney test)
