
Figure 3. Functional Analysis of GLCCI1 Allelic Variation.
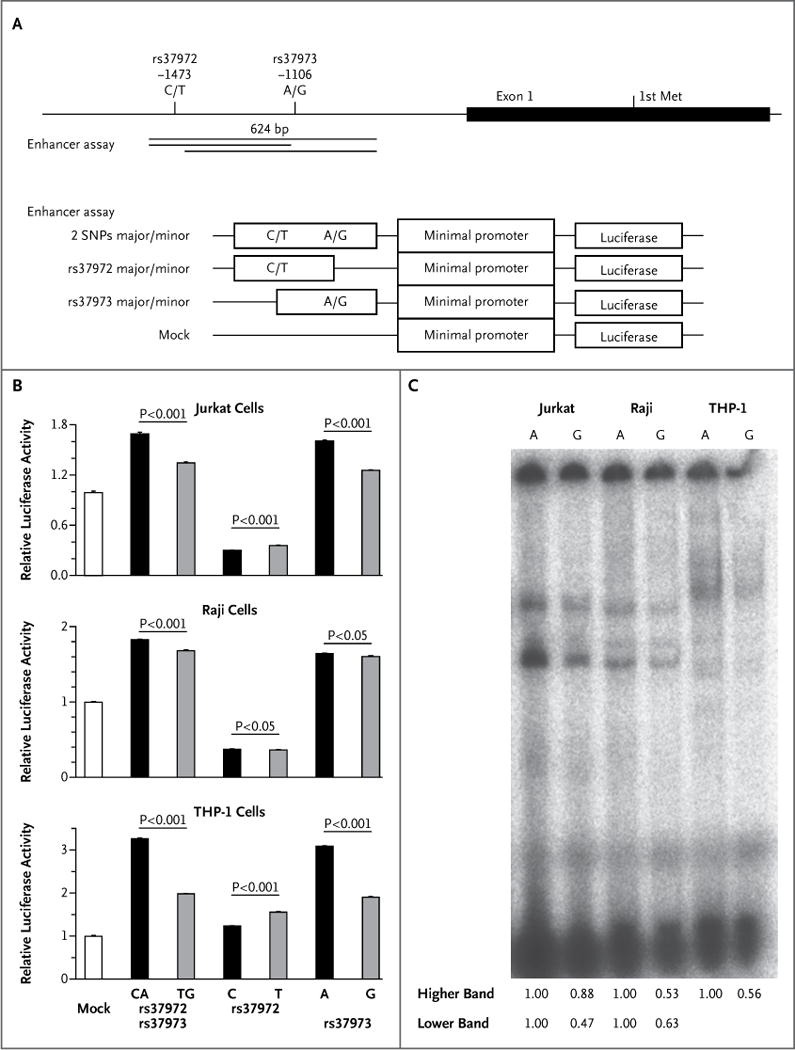
Panel A shows a graphical overview of the rs37972 and rs37973 single-nucleotide polymorphisms in relation to the first exon structure of GLCCI1. The position of the first methionine (Met), the start codon of GLCCI1, is shown. Indicated DNA fragments were cloned into luciferase vectors for the enhancer assay. Panel B shows the allelic differences in relative luciferase activity in Jurkat cells, Raji cells, and human acute monocytic leukemia (THP-1) cells, obtained with the use of a pGL4.23–luciferase vector. Data represent mean (± SD) values from one experiment performed in triplicate and are expressed relative to the luciferase activity of the mock transfectant, which was arbitrarily set at 1. P values were calculated with the use of Student’s t-test. Similar results were obtained in three independent experiments. Panel C shows results of an electrophoretic mobility-shift assay (EMSA) of rs37973 in Jurkat, Raji, and THP-1 cells. The intensity of each band on EMSA was analyzed by densitometry, and the intensity ratio of each G-allele band to each A-allele band is shown. Two independent experiments were performed with similar results. The genomic region containing the A allele of rs37973 was predicted to bind two transcription factors, CCAAT/enhancer binding protein (C/EBP) alpha and zinc finger E-box binding homeobox 1 (ZEB1). Although the signal intensity of the DNA–protein complex derived from the A allele was higher than that from the G allele in the presence of nuclear extract of each of the cell lines on EMSA, we could not confirm the binding of C/EBP alpha and ZEB1 to the sequence by supershift assay (data not shown). It is possible that other, unidentified transcription factors might bind to this sequence.