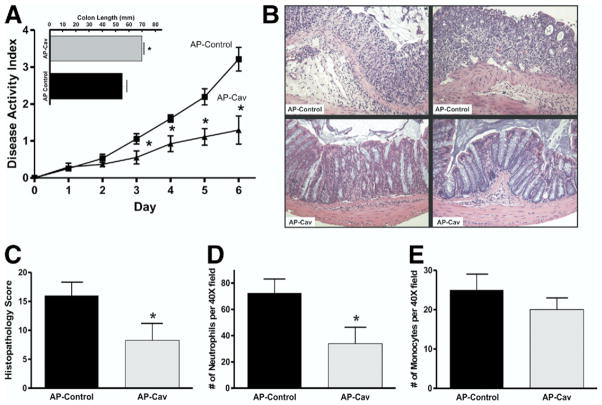
Figure 3.
Pharmacologic inhibition of Cav-1 attenuates experimental colitis. (A) The disease activity index for mice treated with 3 mg/kg of AP control and AP-Cav delivered intra-peritoneally daily during the DSS model are shown. Top: colon lengths for AP control and AP-Cav–treated mice. (B) Sample H&E images of more severe (left) and less severe (right) colitis for both groups. (C) The histopathology scores are shown. (D and E) Numbers of neutrophils and monocytes counted per 40× field for both groups. (A) Statistics performed with the Student t test and comparisons for the disease activity index were made at each time point. n = 8, *P < .05. (E) P = .11.

