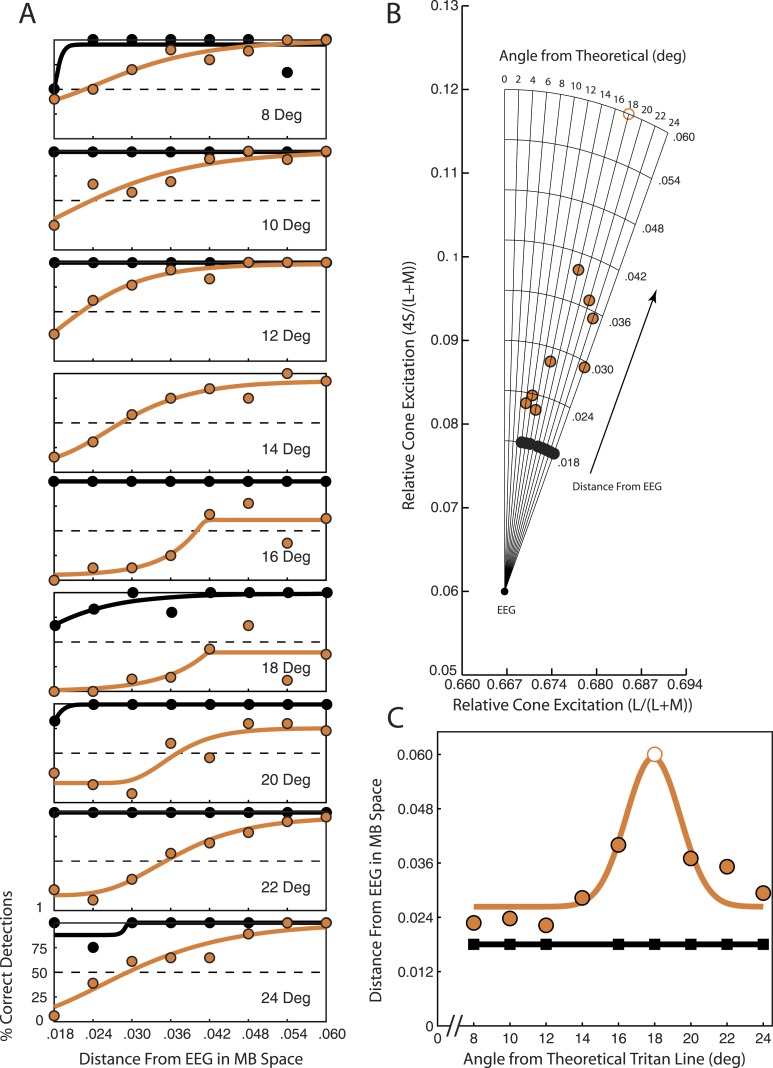
Figure 3.
Tritan line calculation from detection thresholds at one spatial location (down left) for monkey FS. Orange circles show data collected after adaptation to the yellow adapting background. Black circles show data collected after adaptation to the white adapting background. (A) Percent correct detections plotted versus distance of the test step stimulus color from EEG in MB space for nine candidate tritan vectors. Orange and black curves are the least-squares logistic fits to the data. Dashed horizontal lines at 50 indicate chosen detection percentage threshold. (B) Detection thresholds computed from the detection curves in A and plotted in scaled MB space. Each point on a candidate tritan vector indicates the detection threshold for that vector as determined from the data in A. (C) Detection thresholds from B are plotted as a function of the candidate tritan vectors (i.e., angle from theoretical tritan line). Here the vertical axis indicates threshold distance from EEG shown in B while the horizontal axis indicates the candidate vector tested. Data points for tritanopia trials were fitted with a least-squares Gaussian function (orange curve) to determine the peak. Data points for control trials were fitted with a least-squares linear function (black line).

