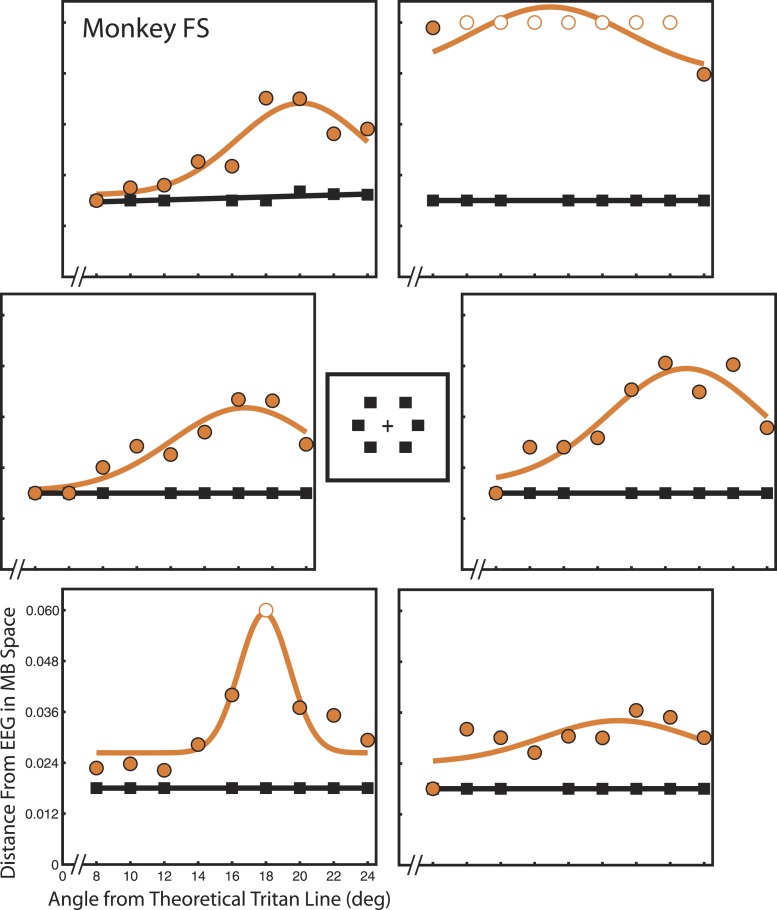
Figure 4.
Detection thresholds for monkey FS. Each panel shows detection thresholds for monkey FS at one of the six spatial locations tested. All locations were 4° eccentricity. Vertical axes represent detection threshold as distance from EEG in scaled MB space. Horizontal axes indicate candidate tritan vector angle. Orange circles indicate data collected during tritanopia trials. Orange curves show least-squares Gaussian fits. Gaussian peaks indicate the angle of greatest threshold increase and thus reveal true S-cone isolating stimuli. Black squares indicate data collected during control trials. Black lines show least-squares linear fits.

